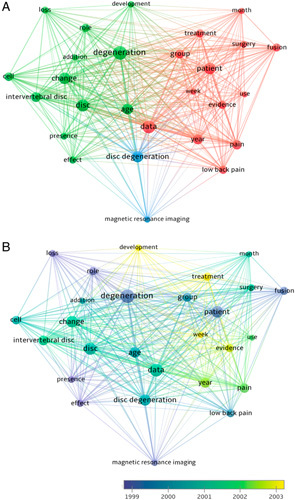
FIGURE 3.

The analysis of keywords. A, Mapping on keywords of intervertebral disk. The words were classified into 3 clusters according to different colors. The lager the circle, the words were used more frequently. B, Distribution of keywords according to when they appeared for the average time. Keywords with blue color presented earlier than that with yellow. Two terms are said to co-occur if they both occur on the same line in the corpus file. In general, the smaller the distance between 2 terms, the larger the number of co-occurrences of the terms.
