
Figure 4. Lack of neuroprotective effects of GT949 in mixed neuron-glia cultures subjected to H2O2-mediated oxidative stress.
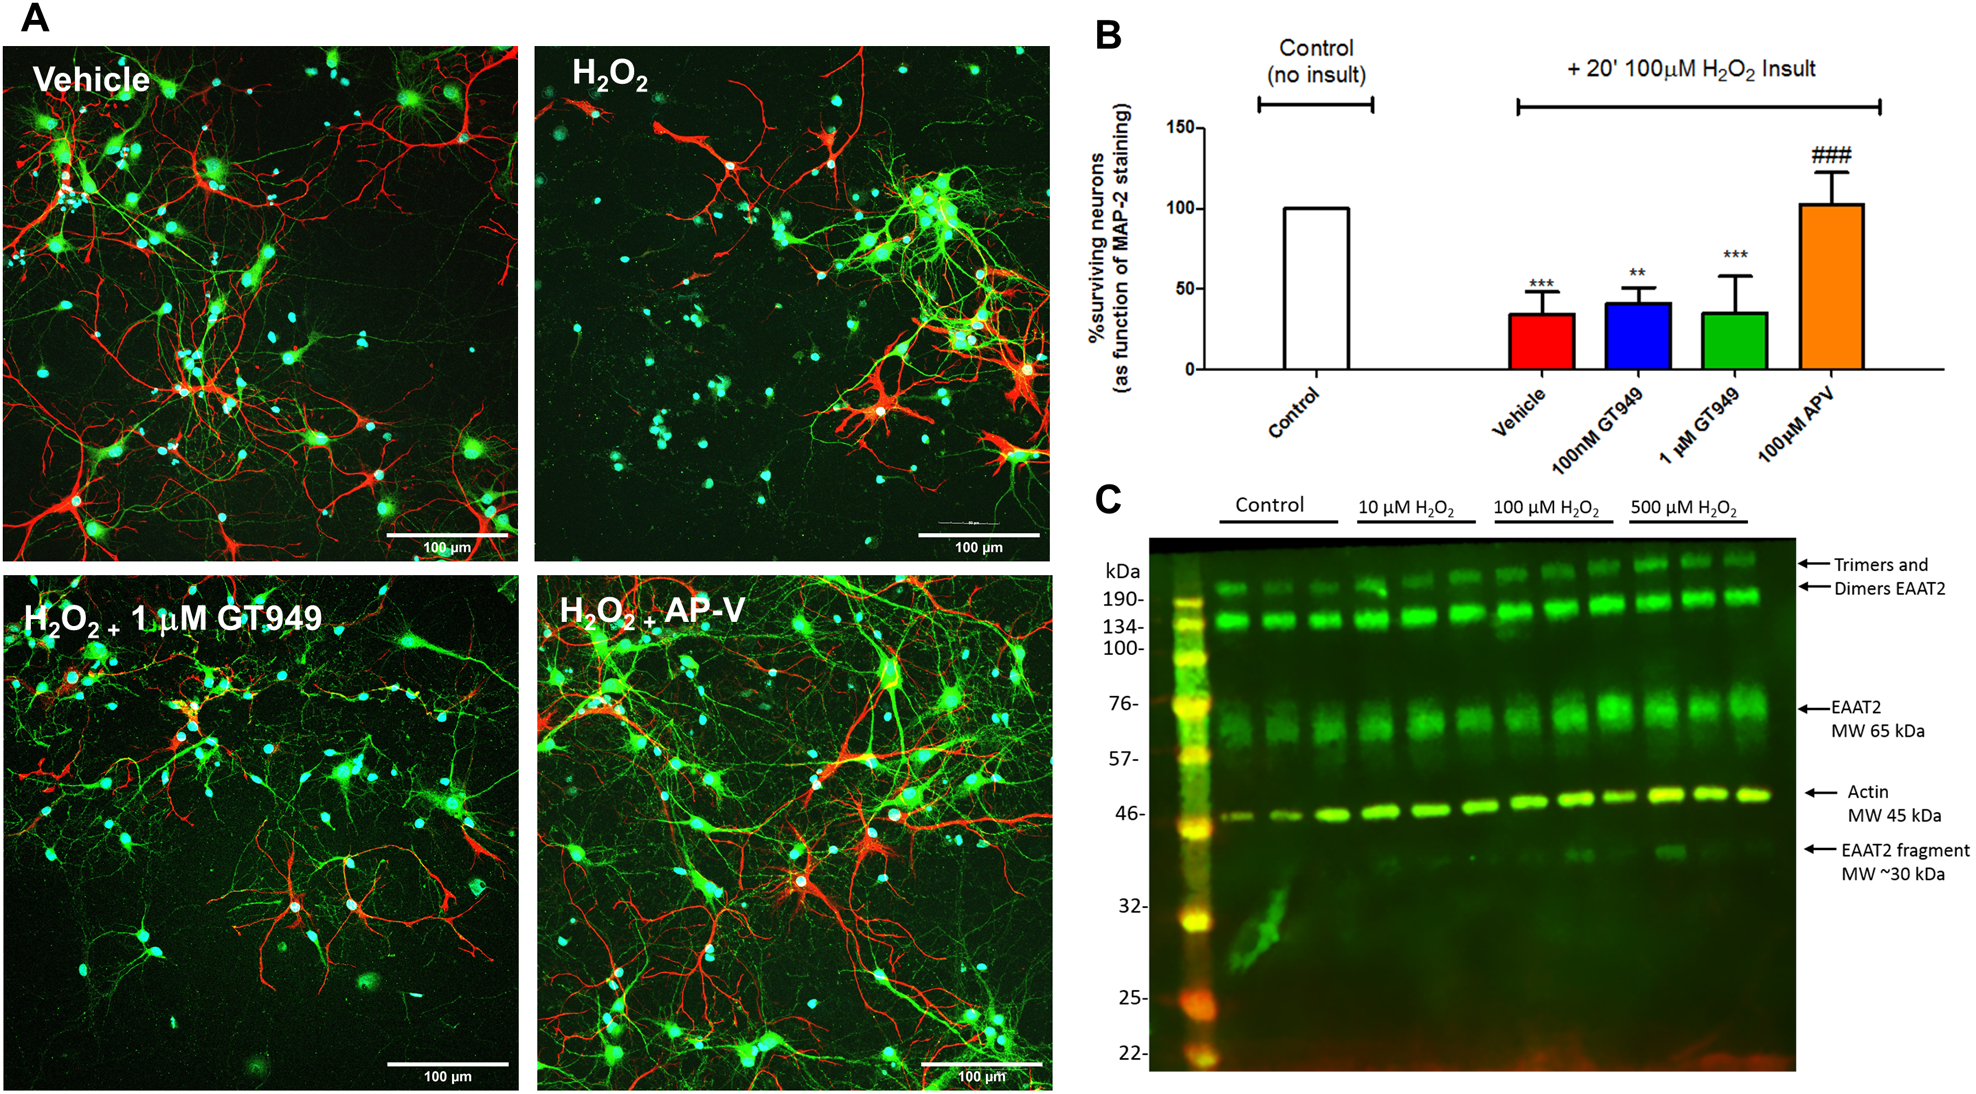
A. Representative images of cultures after different treatments, with neuronal marker MAP-2 in green, glial marker GFAP in red, and counterstaining with the nuclear marker DAPI (blue). Cultures exposed to vehicle do not display obvious degeneration or cell death. Cultures acutely exposed to H2O2 (20 min, 100 μM) show increased DAPI positive, MAP-2 negative cells, indicative of toxicity and neuronal death. Co-exposure of 1 mM GT949 did not change the level of neuronal death, whereas co-incubation with 100 mM AP-V reversed a portion of the cellular damage caused by H2O2. All images are shown at 30x magnification. Scale bar: 100 μm.
B. Quantification of neuronal survival. Cultures were treated with 100 μM H2O2 for 20 minutes, followed by media replacement and compound treatment for 24 hours. Cultures were then fixed and immunostained for neuronal death analysis as in A. Survival quantification was normalized to control cultures, with 3 coverslips assessed per treatment condition per experiment. Neuronal survival data is representative of 2 independent experiments (n=6) and control levels were not statistically different for normalization purposes. ****p<0.0001, vs. control (no insult), ###p<0.001, ##p<0.01, vs. H2O2 insult.
C. Representative immunoblot showing cleavage of the EAAT2 transporter after treatment with higher concentrations of H2O2. Each treatment group represents 3 lanes; from left to right: control (no insult), 10 μM, 100μM and 500 μM H2O2. EAAT2 expression is shown in green and beta-actin in red (used as a loading control). MW= Molecular weight.