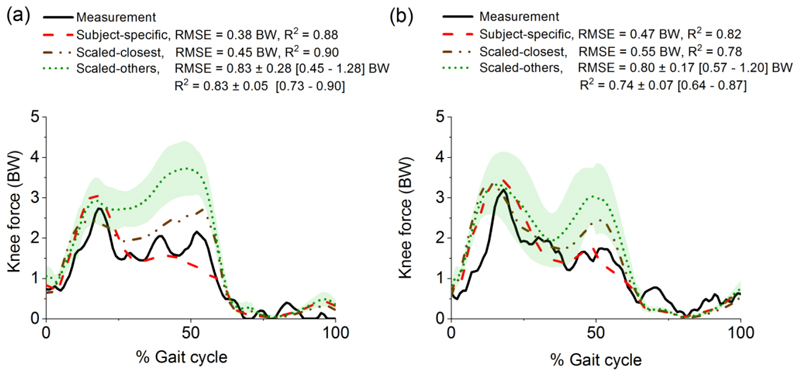
Fig. 6.
Predicted knee joint reaction force, expressed in body weight (BW), using eleven models in the atlas compared to the experimental measurement (solid line) and the subject-specific prediction (dashed line) in two representative gait cycles: (a) DM_ngait1 and (b) DM_bouncy5. The subject-specific model of DM from Ding et al. [39] is freely available at http://www.msksoftware.org.uk/software/freebody. The scaled-closest model is identified based on the regression; the scaled-others are presented as mean (dotted line) and standard deviations (shaded area). The root mean square error (RMSE) and coefficient of determination (R2) are calculated by comparing the difference between the model prediction with the experimental measurement. The RMSE and R2 from the scaled-others models are expressed as mean ± standard deviation [range].

