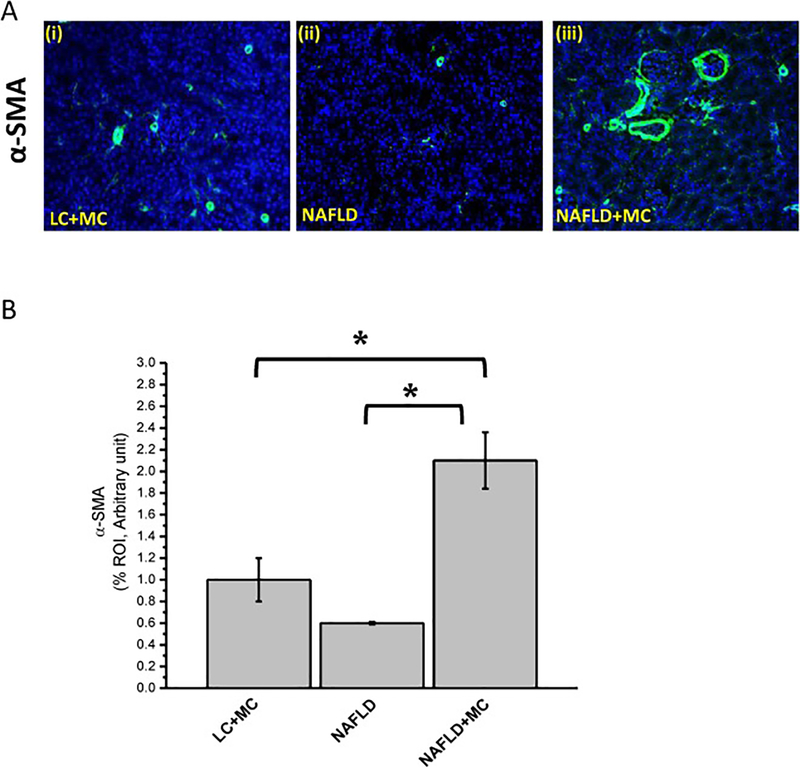
Fig 2: Microcystin exposure augment mesangial cell activation in NAFLD.
Formalin-fixed, paraffin-embedded 5 μm kidney tissue sections from lean mouse control, wild type mouse control fed with MCD-HFD diet (NAFLD), and mice group fed with MCD-HFD diet exposed to microcystin (NAFLD+MC) were used for immunofluorescence imaging. (A) (i-iii): Immunoreactivity of alpha smooth muscle actin (α-SMA, a marker for mesangial cell activation) as shown by immunofluorescence in kidney slices from mice groups NAFLD which serve as a control, NAFLD mice exposed NAFLD+MC, lean+ MC. Images were taken at 20X. (B) Morphometric analysis of α-SMA immunoreactivity (mean data measured as arbitrary light units from three separate microscopic fields were plotted on y-axis) in NAFLD, NAFLD+MC, and lean+MC groups (*P<0.05). The graph shows a summary of the data, represented as mean SD (n=5 mice per group). Variables were compared for significance using two-way analysis of variance and the Bonferroni test (*, P value between 0.01 and 0.001).

