
Fig. 1.
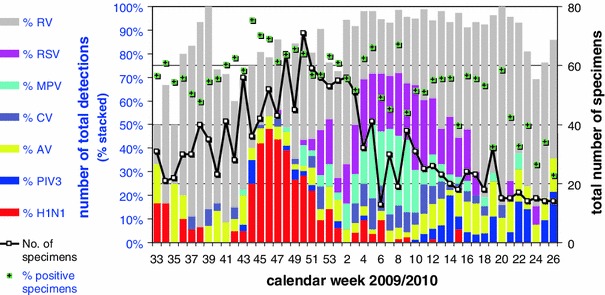
Detection of “top seven” epidemic pathogens in the period between weeks 33/2009 and 26/2010. Incidence of positive influenza A(H1N1) virus detections with a peak in week 46 is given in red. See "Methods" for the definitions of the abbreviations for the pathogens