
Fig. 10.
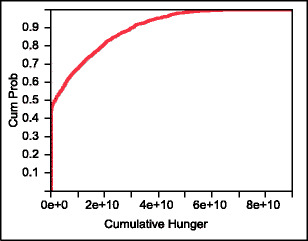
A cumulative distribution plot for hunger-days in the 2,000 simulation runs when food storage at farms was increased. There were no hunger-days in 46 % of the runs and a positive number of hunger-days in the other 54 % of the runs. This result is almost identical to the scenario with less farm storage