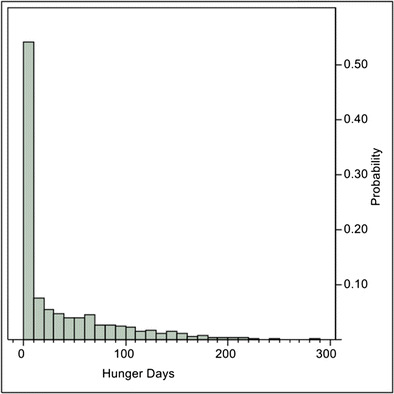
Fig. 5.

Frequency distribution from the 2,000 model simulation runs, showing the total number of hunger-days per capita at the end of the 800 days in each run. Fifty percent of the simulation runs had no hunger-days. The median is roughly five hunger-days per person. Results from the runs with positive hunger-days indicate a significant reduction in the amount of available food due to worker absenteeism during a pandemic
