Fig. 1.

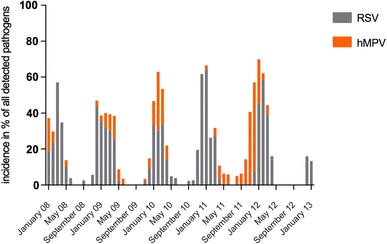
Seasonal distribution of RSV and hMPV. The figure shows the detection rates for RSV and hMPV in percent of all the detected pathogens for each month from January 2008 to January 2013

Seasonal distribution of RSV and hMPV. The figure shows the detection rates for RSV and hMPV in percent of all the detected pathogens for each month from January 2008 to January 2013