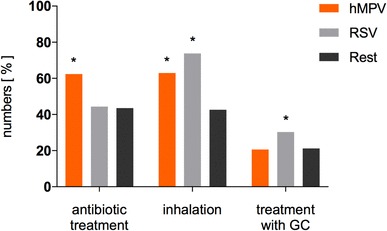
Fig. 3.

Frequency of antibiotic treatment, inhalation, and GC treatment. The figure shows the percentage of patients treated with antibiotics, inhalation, or glucocorticoids (GC) depending on the detected pathogen. The asterices indicate the level of significance (*p < 0.0001) when comparing hMPV or RSV to the remaining detected pathogens
