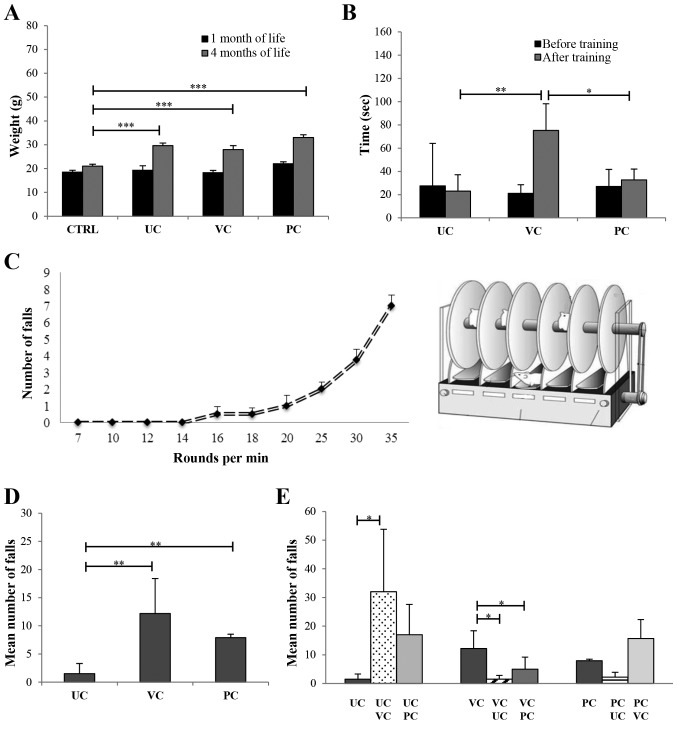
Figure 2.
Effects of different training protocols on physical and performance parameters. (A) Weight variations in control and trained mice 1 and 4 months after birth. The mean body weight in the control group was 18.5±0.6 g after 1 month and 21±0.8 g after 4 months. In the mice that were to be trained, the mean body weight was 19.2±1.9 g in the UC group, 18.2±0.9 g in the VC group and 22±0.6 g in the PC group 1 month after birth and did not differ significantly from either the control or each other. After 4 months, the mean body weight was 29.6±1.1 g in the UC group, 28±1.6 g in the VC group and 33±1.1 g in the PC group, and was significantly higher in all the training groups compared with the control. (B) Mean suspension time on the dynamometer test before and after training. The mean suspension times prior to training were 27.5±36.6 sec in the UC group, 18.4±8.2 sec in the VC group and 27±14.8 sec in the PC group, and there was no significant differences between the times. At the end of training, the mean suspension times were 23±14.1, 75.3±23 and 32.7±9.4 sec, in the UC, VC and PC groups, respectively. The difference in the mean suspension time of VC vs. UC and VC vs. PC was significant. (C) Incremental test performed prior to the initiation of training. There were 4 speed zones on the RotaRod: Low intensity, >7 and ≤14 RPM; average intensity, >14 and ≤20 RPM; high intensity, >20 and ≤30 RPM; and very high intensity, >30 RPM. (D) Mean number of falls during the training protocol in each of the three training groups were 1.5±1.8 in the UC group, 12.2±6.2 in the VC group and 7.9±0.6 in the PC group. The mean number of falls was significantly higher in the VC and PC training group compared with the UC training group. (E) Mean number of falls in mice crossed-over a different protocol. The mean number of falls in the UC animals crossed over to VC training was 32±21.8, total falls 128; and when crossed-over to PC training it was 17±10.6, total falls 68. When VC trained mice were crossed over to UC training, the mean number of falls was 1.5±1.3, total falls 6; and when crossed-over to PC training the mean number of falls was 5±4.2, total falls 20. Mean number of falls in the PC animals crossed-over to UC training was 2.25±1.70, total falls 9; and when crossed-over to VC training, the mean number of falls was 15.75±6.60, total falls 63. *P<0.05, **P<0.01 and ***P<0.001. CTRL, control; UC, uniform continuous; VC, varying continuous; PC, progressive continuous.

