
Figure 2. Modeling 5′ UTR sequences and ribosome loading.
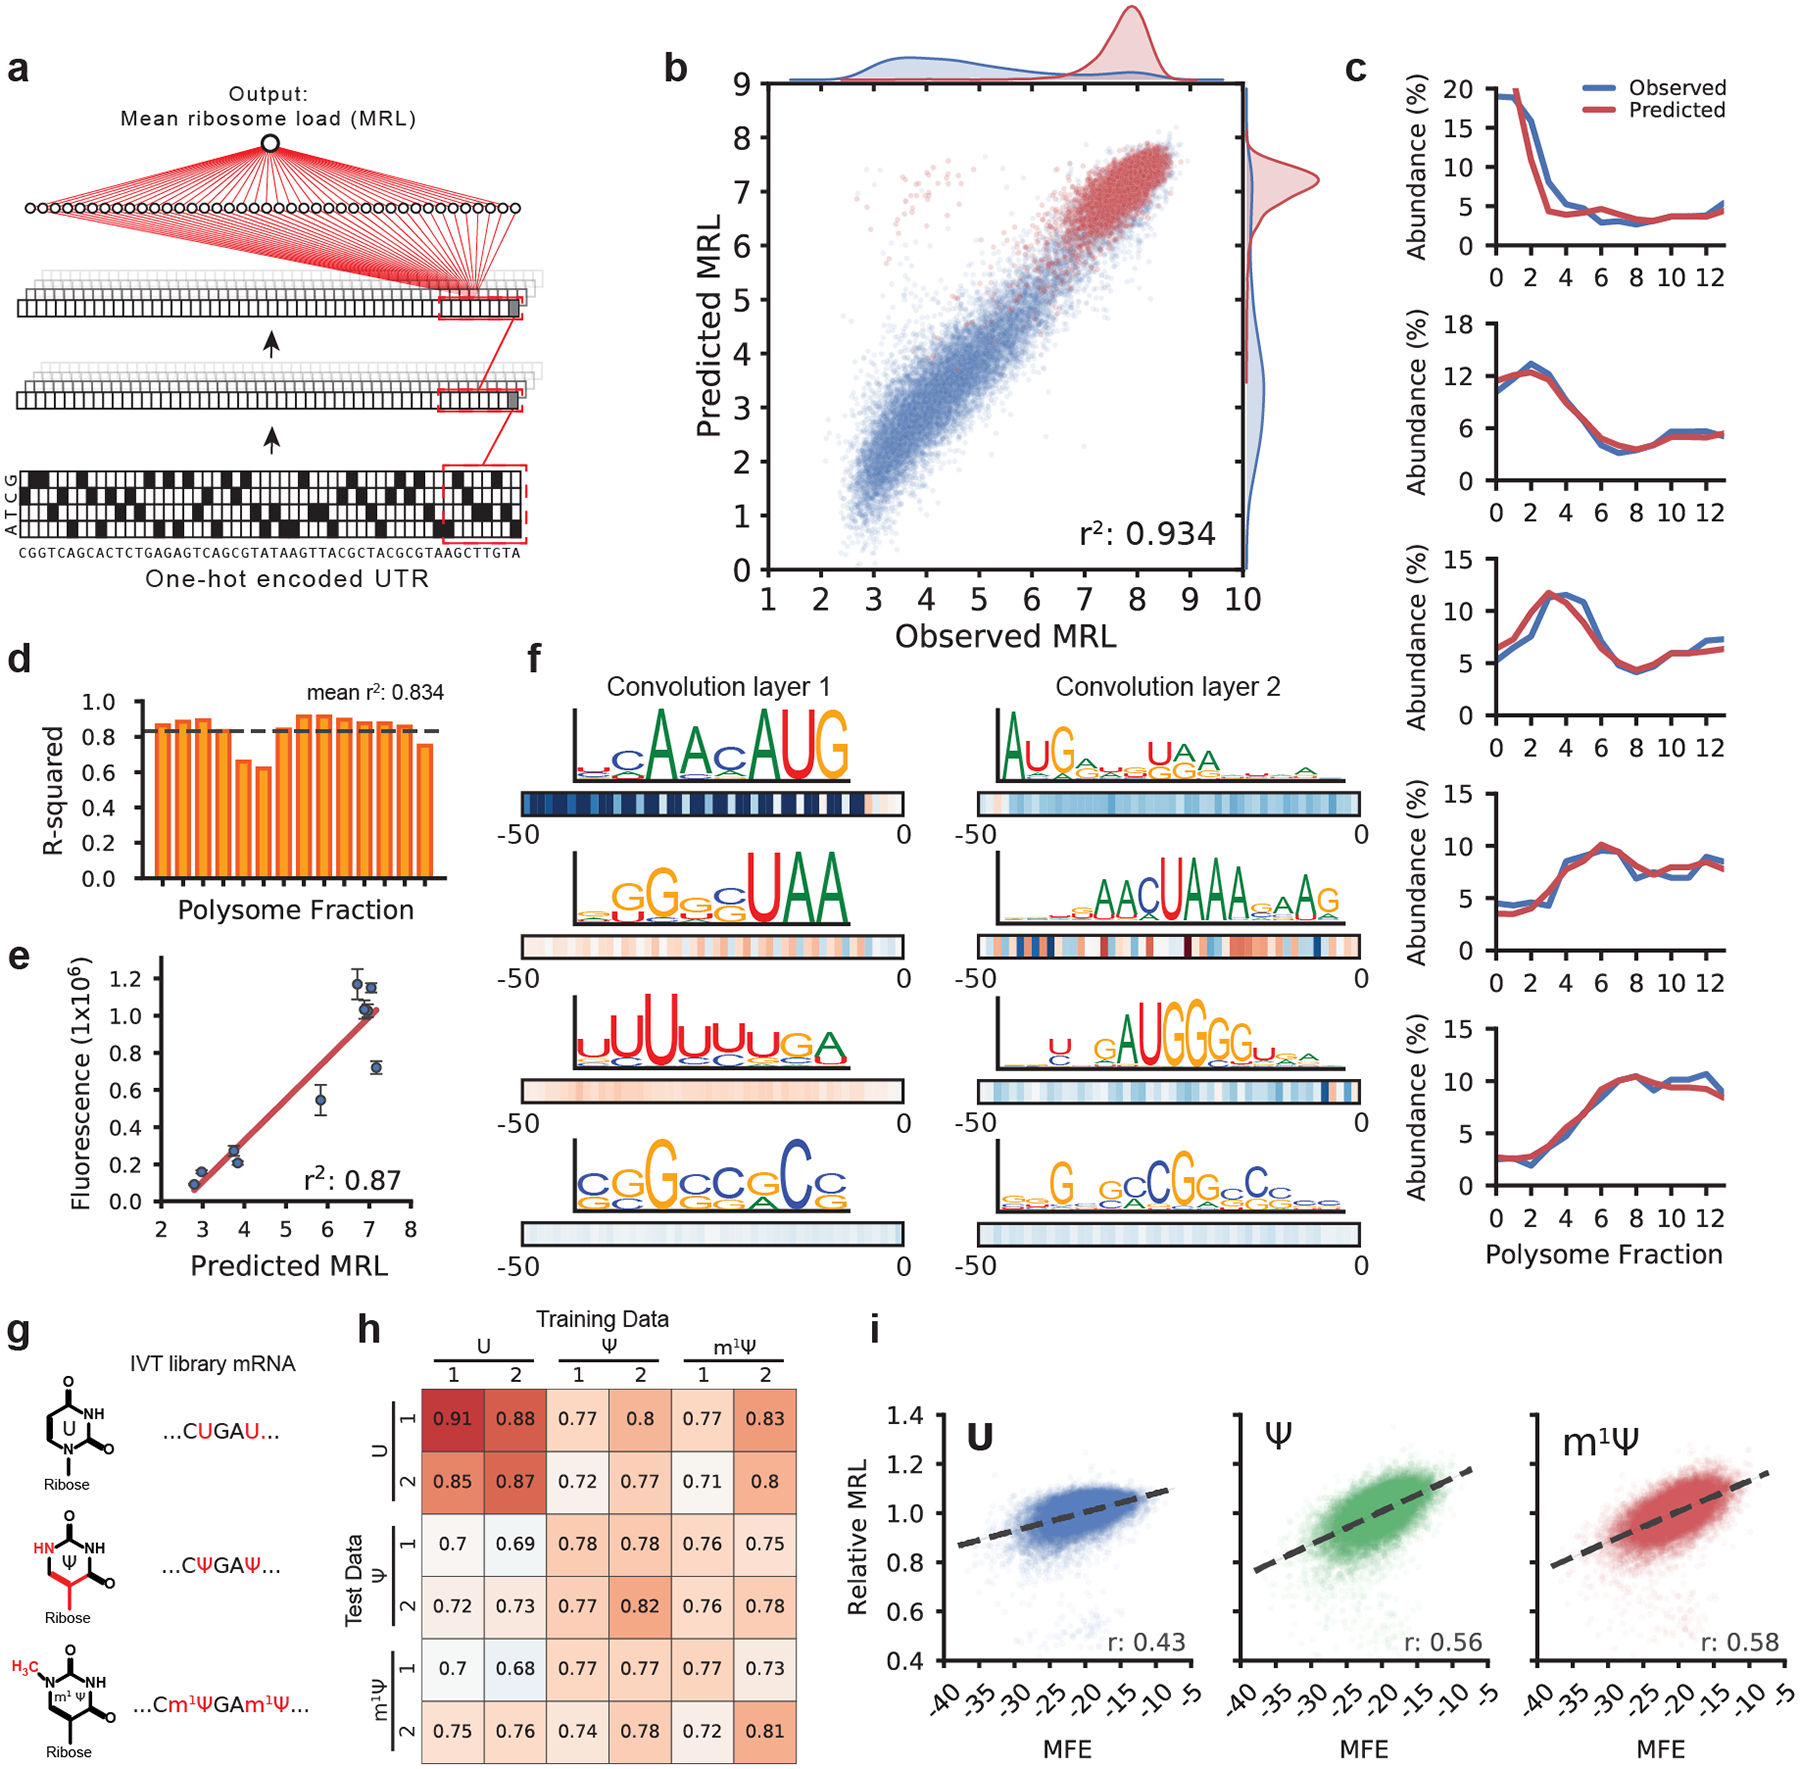
(a) Optimus 5-Prime structure: A one-hot encoded 5′ UTR sequence is fed into a CNN composed of three convolution layers and a fully connected layer to produce a linear output predicting MRL. (b) Optimus 5-Prime trained on 260,000 UTRs and tested on 20,000 held-out sequences could explain 93% of the variability in observed MRLs. Blue dots represent sequences with an uAUG while red dots represent sequences without uAUG (n = 20,000). (c) A similar model was trained to predict the polysome profile distribution of an individual 5′ UTR. The observed (blue) and predicted (red) polysome distribution of 5 random picked example UTRs out of 20,000 in the test set spanning MRLs from 4 to 8 (top to bottom) are shown. (d) The performance of the polysome profile model per fraction ranged from an r2 of 0.621 to 0.915 and an average of 0.834 across all fractions (n = 20,000). (e) eGFP expression for ten UTRs selected from the library were evaluated via eGFP fluorescence using IncuCyte live cell imaging (n = 3, centers are the means, error bars are s.e.m.). Predicted MRL and fluorescence are highly correlated (r2: 0.87, n = 10). For details, see Supplementary Table 2. (f) Visualization of four out of 120 filters from the first convolution layer (left) and four out of 120 filters from the second convolution layer. Boxes below show correlation (Pearson r) between filter activation and MRL at each UTR position. Filters learned important regulatory motifs such as start and stop codons, uORFs, and GC-rich regions likely involved in secondary structure formation. (g) IVT mRNA from the eGFP library were generated with pseudouridine (Ψ) or 1-methylpseudouridine (m1 Ψ) in place of uridine (U) and evaluated by polysome profiling and modeling. (h) Model performance trained and tested on different data sets (r-squared). The unmodified RNA (U) models perform best with U data, while the Ψ and m1 Ψ models perform equally well with Ψ and m1 Ψ test data (n = 20,000). (i) Ribosome loading as a function of MFE. U is less dependent on secondary structure than Ψ and m1 Ψ (Pearson r: 0.43, 0.56, and 0.58, respectively. n = 19,976).