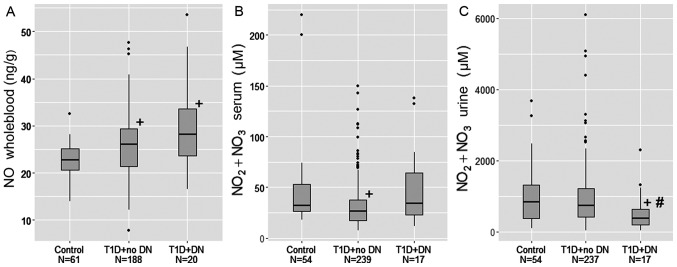
Figure 1.
Markers of NO metabolism in biological fluids of study subjects. (A) Concentration of NO in study groups. (B) Concentration of serum NO2-+NO3- in study groups. (C) Concentration of NO2-+NO3- in urine in study groups. +P<0.05 vs. control group; #P<0.05 vs. T1D+no diabetic nephropathy. T1D, type 1 diabetes; DN, diabetic nephropathy; NO, nitric oxide; NO2, nitrite; NO3, nitrate.

