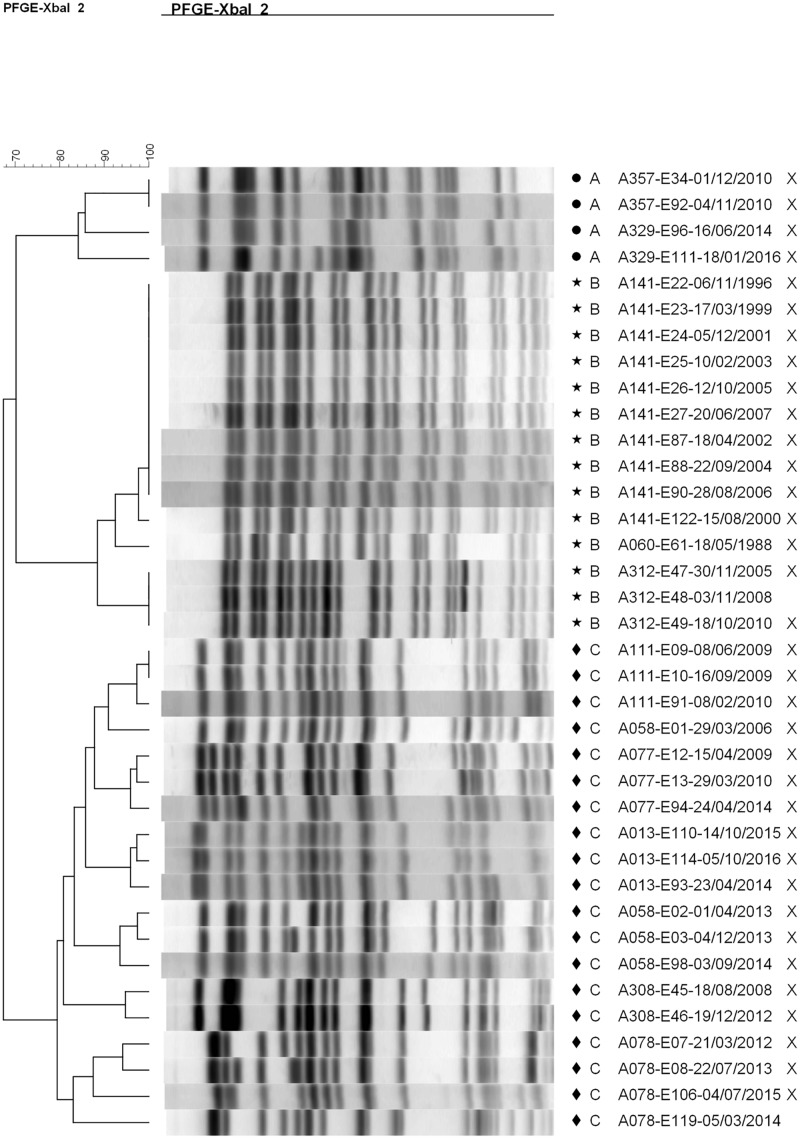
FIGURE 2.
Dendrogram showing pulsotype relationships between isolates belonging to shared pulsotypes. A (circle) = pulsotype cluster A (ST-1193), B (star) = pulsotype cluster B (ST-73), and C (diamond) = pulsotype cluster C (ST-131). Isolates sequenced in this study are marked with an “X”. The dendrogram was generated using the UPGMA method with 2% tolerance. Isolate names are coded as “patient identifier”-“isolate number”-“culture date of isolate (dd-mm-yyyy)”.

