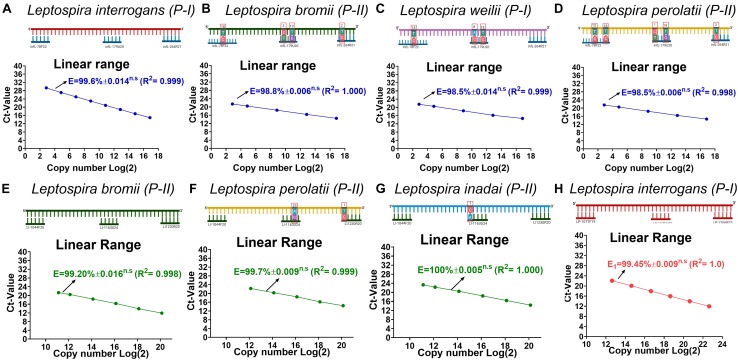
FIGURE 2.
Evaluation of the effect on efficiency of the reaction caused by each mismatch found on each target region. (A–D) Evaluation of the effect on efficiency of the reaction for the target region of infectious Leptospira spp. group, (E–G) pathogenic group II, and (H) pathogenic group I. All polymorphisms denoted (∗) in Figure 1 were assessed and the efficiency values compared with 100% match for the primers/probe sets represented in (A) and (D) L. interrogans for infectious Leptospira group and pathogenic group I, (B) L. bromii for pathogenic group II. All the mismatches between the template target and the primers and probes are denoted highlighting the position and the replacement. All the Leptospira spp. strains used are denoted. The efficiency values, dynamic range, and linearity of the amplification reaction for the target regions are shown: (A–D) specific for the detection of infectious Leptospira spp. group denoted in blue, (E–G) specific for the detection of pathogenic group II denoted in green, and (H) Leptospira group I denoted in red. n.s: no statistically significant differences.

