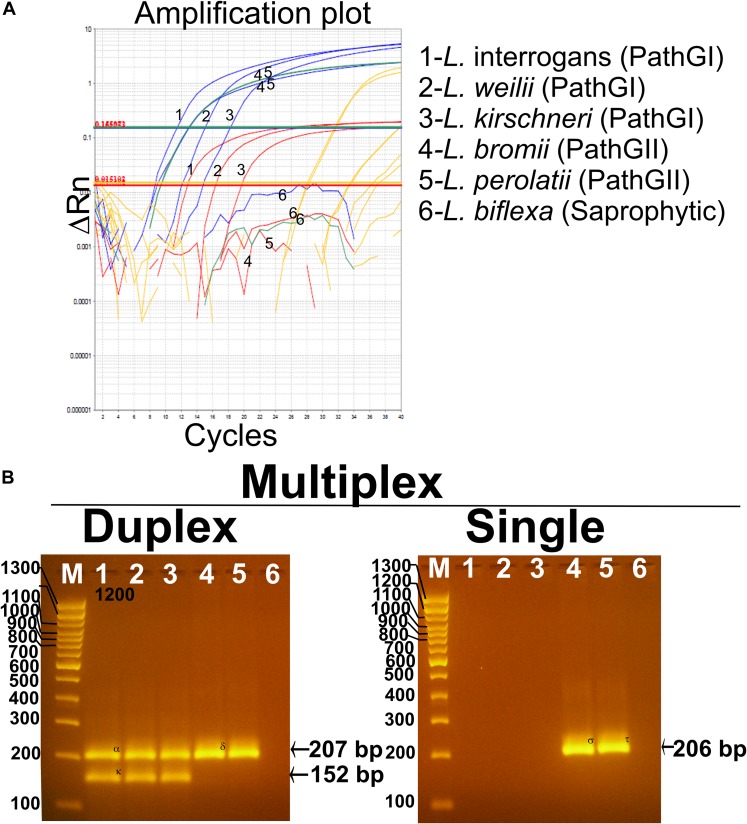
FIGURE 5.
Performance of the multiplex qPCR assay on different Leptospira spp. strains. (A) Amplification curves for each sample using different Leptospira spp. strains included in pathogenic group I (L. interrogans, L. weillii, and L. kirschineri), pathogenic group II (L. bromii and L. perolatii), and saprophytic group (L. biflexa), also listed in Table 1. Amplification curves for the infectious Leptospira spp. group are shown in blue, amplification curves for the pathogenic group I are shown in red, amplification curves for the pathogenic group II are shown in green, amplification curves for internal control are shown in yellow, Leptospira spp. used as representative strains are denoted. (B) Confirmation of the amplification products resulting from the multiplex qPCR assay by electrophoresis on 3% agarose gel. In all case, 1—L. interrogans; 2—L. weillii; 3—L. kirschineri; 4—L. bromii; 5—L. perolatti; 6—L. biflexa; and M—molecular weight marker, 100 bp (Thermofisher scientific cat no. 15628019). Specific amplification product sizes are denoted: (infectious Leptospira spp. = 207 bp, pathogenic group I = 152 bp, and pathogenic group II = 206 bp). Confirmation by sequencing of the amplification products was also accomplished (see Supplementary Text S2).

