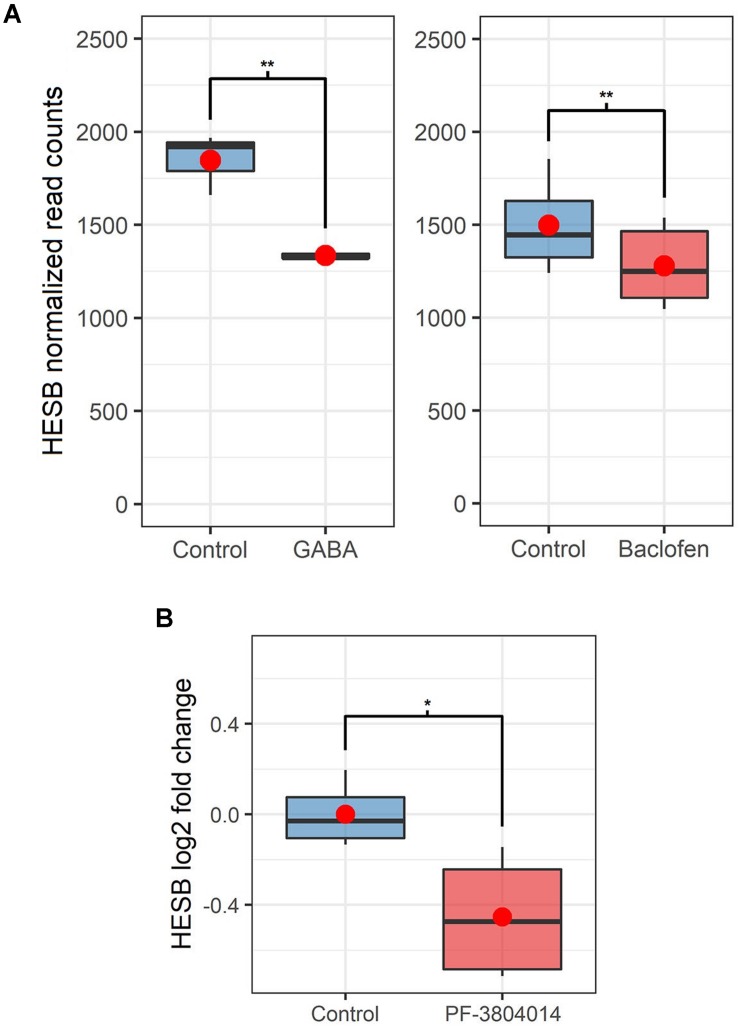
FIGURE 2.
Changes in HESB expression in the brainstem of injured animals after drug treatments. (A) Changes in the expression of HESB in the brainstem of injured animals after GABA or baclofen treatments (RNA-Seq). HESB gene expression is represented as read counts normalized by DESeq’s median of ratios, and ** represents that the differences between the two groups are significant with false discovery rate corrected p-values between 0.01 and 0.001. Note that results are not comparable between the 2 RNA-Seq experiments. (B) Change in the expression of HESB in the brainstem of 1 wpl animals after the PF-3804014 treatment (qPCR). HESB expression is represented as log2 fold change in comparison to the mean of the controls, and * represents that the differences between the two groups are significant with p-value between 0.05 and 0.01. For both A and B, boxplots show the median, 25th and 75th percentiles, red dots represent the mean and whiskers extend to the most extreme data point which is no more than 1.5 times the length of the box away from the box.

