
FIGURE 3.
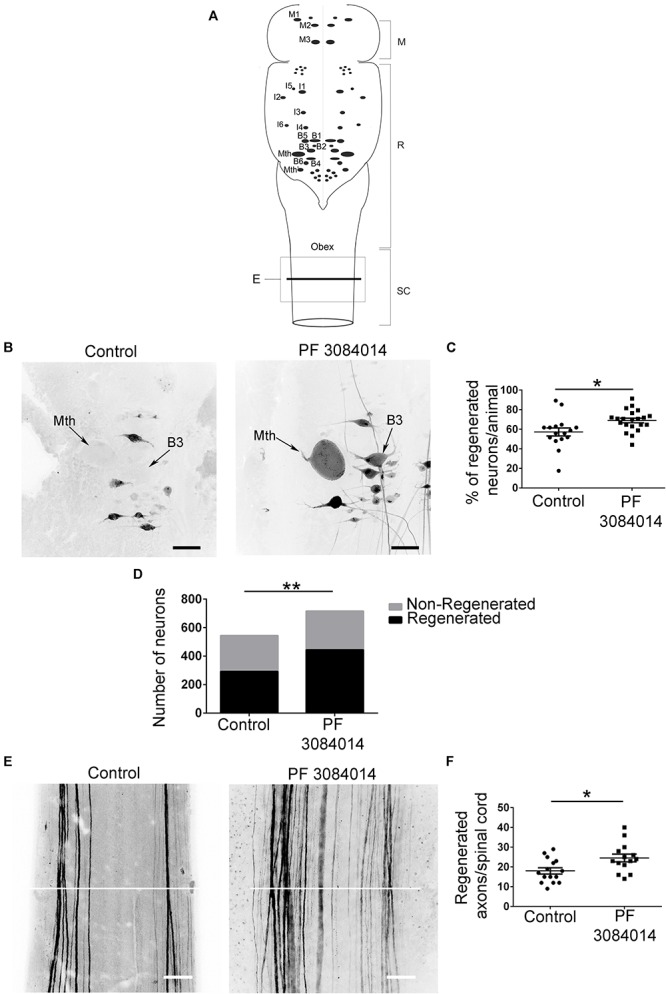
PF-3804014 promotes axon regeneration after a complete SCI. (A) Schematic drawing of a dorsal view of the sea lamprey brainstem showing the location of giant individually identifiable descending neurons (modified from Sobrido-Cameán and Barreiro-Iglesias, 2018). The box marked “E” indicates the spinal cord region shown in Panel E. The line used to count the number of regenerated axons in the spinal cord is also indicated. M, mesencephalon; R, rhombencephalon; SC, spinal cord. (B) Photomicrographs of dorsal views of whole-mounted brains showing regenerated identifiable descending neurons, as identified by retrograde tracer labeling, in control and PF-3804014 treated animals. Note the increased number of labeled (regenerated) identifiable neurons in PF-3804014 treated animals. (C) Graph showing significant changes (asterisk) in the percentage of regenerated identifiable descending neurons per animal (controls: n = 16 animals; PF-3804014 treated: n = 21 animals) after the PF-3804014 treatment (control: 57,22 ± 4.132%; PF-3804014: 68.95 ± 2.354%). (D) Graph showing significant changes (asterisks) in the total number of regenerated neurons after the PF-3804014 treatment (control: 292 neurons regenerated, 252 non-regenerated; PF-3804014: 444 neurons regenerated, 272 non-regenerated). (E) Photomicrographs of whole-mounted spinal cords showing regenerated axons, as identified by tracer labeling, in control and PF-3804014 treated animals. Note the increased number of regenerated axons in PF-3804014 treated animals. The line used to count the number of regenerated axons in the spinal cord is also indicated in white. (F) Graph showing significant changes (asterisk) in the number of regenerated axons per spinal cord after the PF-3804014 treatment (control: 18 ± 1.588 axons, n = 15 animals; PF-3804014: 24.57 ± 1.955 axons, n = 14 animals). Rostral is up and scale bars correspond to 100 μm.