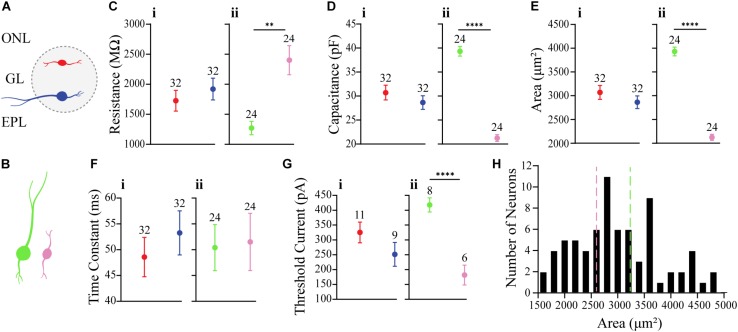
FIGURE 2.
Comparison of membrane properties between OB DA neurons based on their localization in the GL and neuronal area. (A) Top, red neurons = closer to ONL; Bottom, blue neurons = closer to the EPL. (B) Large, green neurons = 3390 to 4890 μm2; Small, pink neurons = 1589 to 2610 μm2. All data represented as mean ± SEM. (C) For membrane resistances (in MΩ), there was no significant difference (n = 64, p = 0.4181, Ci) between neurons based on their glomerular localization, but there was a significant difference (n = 48, p = 0.0001**, Cii) based on neuronal area. (D) For membrane capacitance (in pF), there was no significant difference (n = 64, p = 0.2979, Di) between neurons based on their glomerular localization, but there was a significant difference (n = 48, p < 0.0001****, Dii) based on neuronal area. (E) For neuronal areas (in μm2), like capacitance, there was no significant difference (n = 64, p = 0.2979, Ei) based on glomerular localization. (F) For time constants (in ms), there was no significant difference (n = 64, p = 0.4153, Fi) between neurons based on their glomerular localization, and no significant difference (n = 48, p = 0.8786, Fii) between neurons based on neuronal area. (G) For action potential thresholds (in pA), there was no significant difference (n = 20, p = 0.1792, Gi) between neurons based on their glomerular localization, but there was a significant difference (n = 14, p < 0.0001****, Gii) between neurons based on area. (H) Frequency distribution of neuronal areas of DA neurons (2996 ± 94.72 μm2, n = 73). Pink and green dashed borders are used to distinguish Small and Large neurons, respectively.

