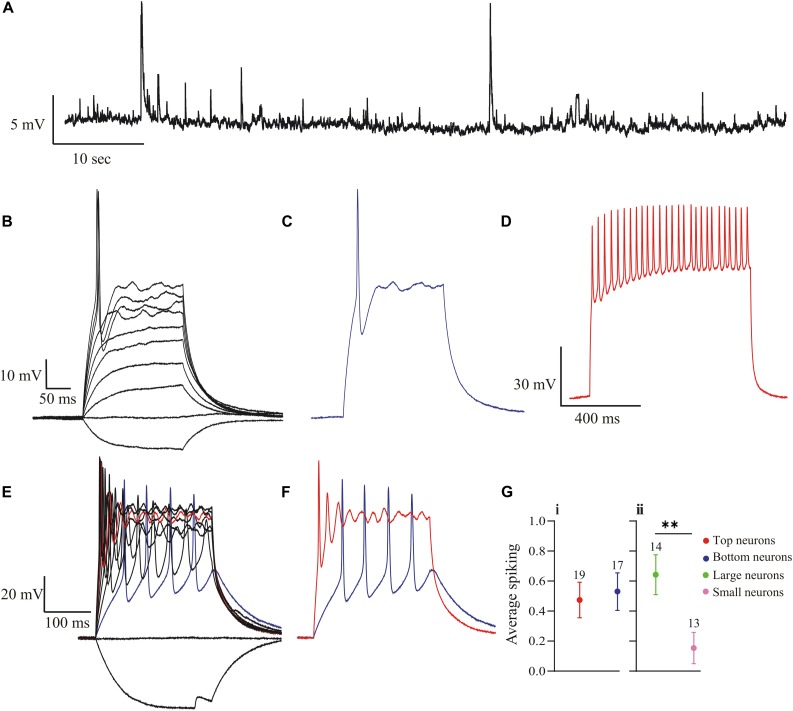
FIGURE 3.
Action potential spiking properties of OB DA neurons. (A) There was no recorded spontaneous action potential activity (generated without stimulus input) in rat OB DA neurons. This recording shows synaptic activity, represented by EPSPs. (B) DA neurons fire a single action potential when stimulated with a sufficiently large depolarizing current. After firing an action potential, they go into depolarization block for the duration of the stimulus. These recordings resulted from incremental 10-pA steps, ranging from –10 to 80-pA. (C) A single trace from Figure 3B, which shows a single action potential generated from an 80-pA stimulus. (D) An example of a trace from a mitral cell (red trace), showing tonic firing in response to a 200-pA stimulus. (E) Some OB DA neurons fire multiple spikes when stimulated with a weaker stimulus (blue trace), but tend to fire a single spike with increasing stimulus strength (red trace). Each voltage trace is a response to incremental 25 pA stimuli, from –25 to 200 pA. (F) Example traces from Figure 3E, which show that a weak stimulus (25 pA in this example, blue trace) produced tonic action potential spiking, while a stronger stimulus (150 pA in this example, red trace) produced decaying spikes followed by a depolarization block. (G) To gauge if DA neurons have different spiking activity based on their glomerular localization and/or neuronal area, dummy variables were assigned to each spiking neuron (0 = no more than one spike at any depolarizing stimulus; 1 = multiple spiker at lower depolarizing stimuli only). There was no significant difference in average number of spikes between neurons based on their glomerular localization (n = 36, p = 0.7472, Gi), but there was a significant difference (n = 27, p = 0.0083**, Gii) between neurons based on neuronal area. Data represented as mean ± SEM.

