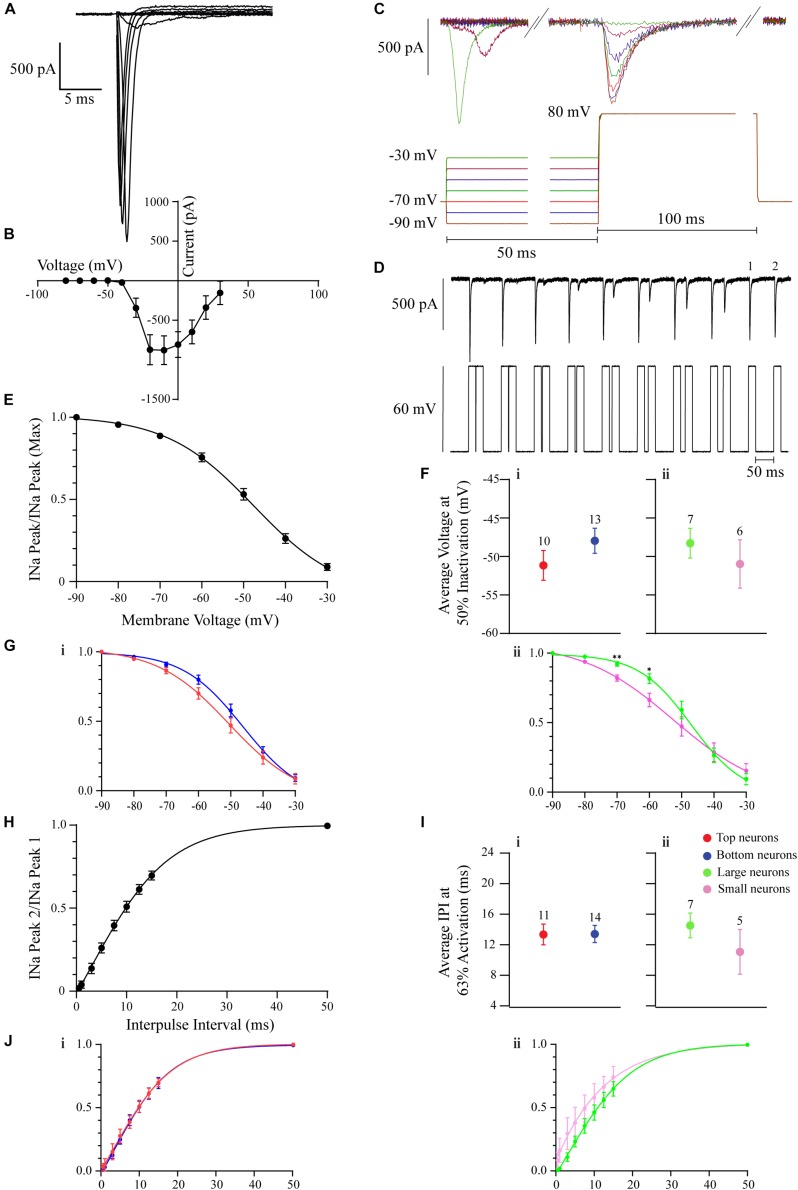
FIGURE 4.
The voltage-gated INa in OB DA neurons. All recordings were performed in the presence of Cs and Cd. (A) Example of a group of INa from a DA neuron. These currents were activated by progressively depolarizing 200-ms 10 mV voltage steps, from –10 to 80 mV. Capacitance artifacts were manually blanked. (B) The current-voltage relationship (derived from 11 neurons) showing peaks of INa. The largest peak amplitudes were produced when the membrane was depolarized between –20 and 0 mV. (C) An example of the protocol used to derive the inactivation/h∞ curve in panel (E). 50 ms pre-pulse voltage steps ranged from –90 to –30 mV in 10 mV steps. Test 100 ms test pulse was 80 mV. Each color of the protocol trace is coordinated with the color of the current trace. (D) An example of the protocol used to derive the removal of inactivation/IPI curve in H. Neurons received paired voltage steps, depolarizing the membrane to 60 mV, with increasing subsequent IPIs (0.5, 1, 3, 5, 7.5, 10, 12.5, 15, and 50 ms). (E) The INa h∞ inactivation curve (derived from 23 neurons). Half of INa is inactive when the membrane is depolarized to –49 mV. (F) To gauge if INa inactivation properties differ between DA neurons based on their glomerular localization and/or neuronal area, their membrane voltages at 50% inactivation were compared. There was no significant difference between neurons based on localization (n = 23, p = 0.2149, Fi) or area (n = 13, p = 0.4645, Fii). (G) Inactivation curves were also compared between Top and Bottom (Gi) and Large and Small (Gii) neurons. For the membrane potentials of –70 and –60 mV, there were no significant differences between Top and Bottom neurons (–70 mV: n = 23, p = 0.1500; –60 mV: n = 23, p = 0.067), while there were significant differences between Large and Small neurons (–70 mV: n = 13, p = 0.0032**; –60 mV: n = 13, p = 0.0258*). (H) The INa IPI curve (derived from 25 neurons). Currents were activated with two 60-mV, 20-ms depolarizing steps. The activation time constant (τ = 63% of the channels are activated) is 13 ms. (I) To gauge if INa reactivation properties differ between DA neurons based on their glomerular localization and/or neuronal area, the average τ were compared. There was no significant difference between neurons based on localization (n = 25, p = 0.9710, Ii) or area (n = 12, p = 0.2913, Iii). (J) Individual IPI curves were also constructed for Top and Bottom (Ji) and Large and Small (Jii) DA neurons. These two sets of curves were similar. Data points are represented as mean ± SEM.

