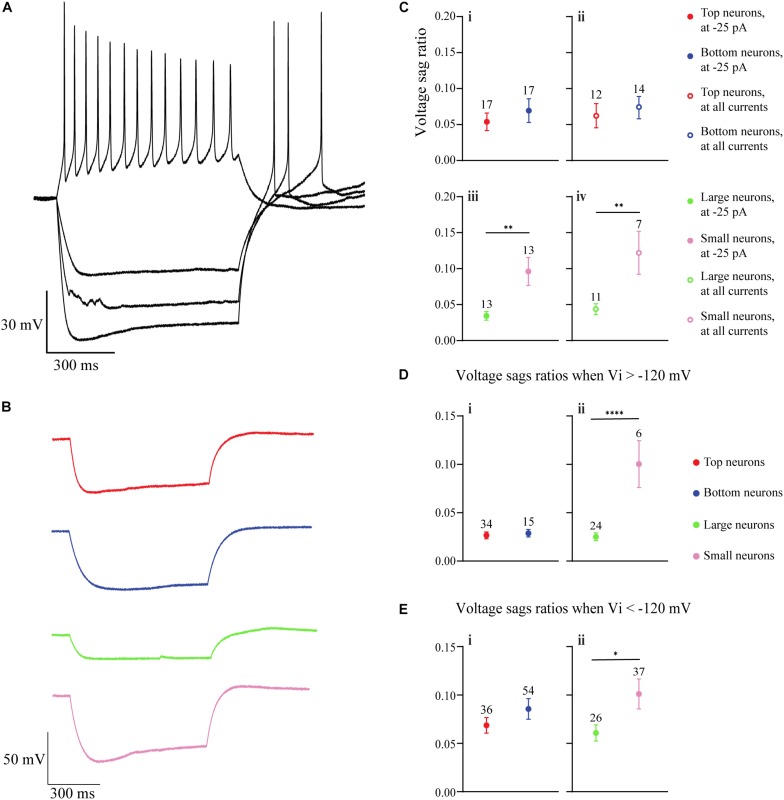
FIGURE 5.
The hyperpolarization-activated, non-specific cation IH in OB DA neurons is identified by upward voltage sags during hyperpolarization, after hyperpolarization depolarization, and (sometimes) an action potential following hyperpolarizing stimuli. (A) An example of a DA neuron showcasing these three properties of IH during three hyperpolarizing current (–25, –50, and –75 pA) injections. (B) Representative hyperpolarizing traces of each of the four groups of DA neurons from this study (red = Top, blue = Bottom, green = Large, pink = Small). All traces are scaled to the scale on the bottom left of the figure. (C) A comparison of voltage sag ratios of DA neurons based on their glomerular localization and neuronal area. There was no significant difference between DA neurons based on their glomerular localization, either when the neurons received a –25-pA stimulus (“at –25 pA,” n = 34, p = 0.4500, Ci) or when receiving a combination of –25, –50, and –75 pA, or all three hyperpolarzing currents (“at all currents,” n = 26, p = 0.5904, Cii). There were significant differences between DA neurons based on the neuronal area, both when receiving only a –25-pA stimulus (n = 26, p = 0.0061**, Ciii) and when receiving the combination of hyperpolarizing currents (n = 18, p = 0.0067**, Civ). (D) Voltage sag ratios of DA neurons were compared at starting membrane potentials positive to –120 mV. There was no significant difference between neurons based on glomerular localization (n = 49 sags, p = 0.6784, Di), but Small DA neurons had a significantly greater voltage sag ratio than Large neurons (n = 30 sags, p < 0.0001****, Dii). (E). Voltage sag ratios of DA neurons were also compared at membrane potentials negative to –120 mV. Again, there was no significant difference between neurons based on glomerular localization (n = 90 sags, p = 0.2576, Ei), but Small DA neurons had a significantly greater voltage sag ratio than Large neurons (n = 63 sags, p = 0.0432*, Eii). All data represented as mean ± SEM.

