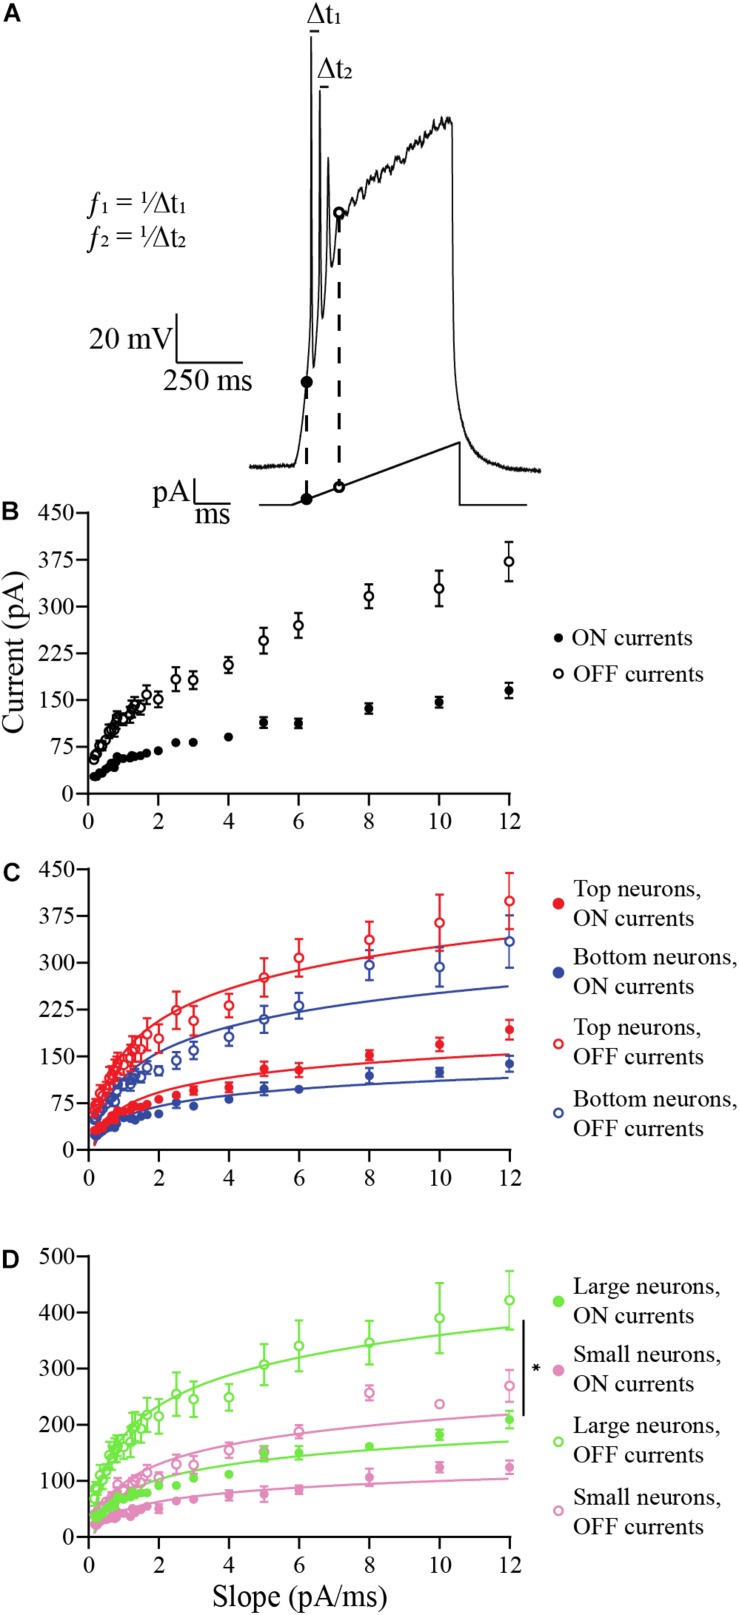
FIGURE 6.
Analysis of the effects of ramp slopes (in pA/ms) on the ON and OFF currents of OB DA neurons. (A) Example of a ramp protocol (bottom) and a resulting voltage trace (top). The traces and their corresponding ramps were used to determine the ON (black circles) and OFF (white circles) currents. This figure also shows an example of how spike frequencies are derived from traces of ramp protocols (data shown in Figure 7). Of the 42 ramps used, some ramps had identical slopes (e.g., the slope of 2 pA/ms can include ramps of 200 pA for 50 ms, 400 pA for 100 ms, etc.). For different ramp protocols with the same slopes, the ON and OFF currents and the spike frequencies and number of action potentials in the next figure were averaged. (B) Averaged ON and OFF current responses to ramp slopes (derived from 19 neurons). Increasing the slope increases the ON and OFF current of all neurons, but the largest effect is on the OFF current. This also indicates a decrease in duration of spiking with increasing ramp slopes. (C) A comparison of ON and OFF currents of DA neurons based on their glomerular localization. After transforming these power functions into log-log plots (see section “Materials and Methods”), there was no significant difference between the increasing ON (n = 19, p = 0.3405) and OFF currents (n = 19, p = 0.5368) with increasing ramp slopes between Top and Bottom neurons. (D) Same comparison between DA neurons based on their neuronal areas. There were no significant differences in the increasing ON current (n = 10, p = 0.7680) with increasing ramp slopes, but there was a difference in the increasing OFF currents (n = 10, p = 0.0402*) between Large and Small neurons. All data represented as mean ± SEM.

