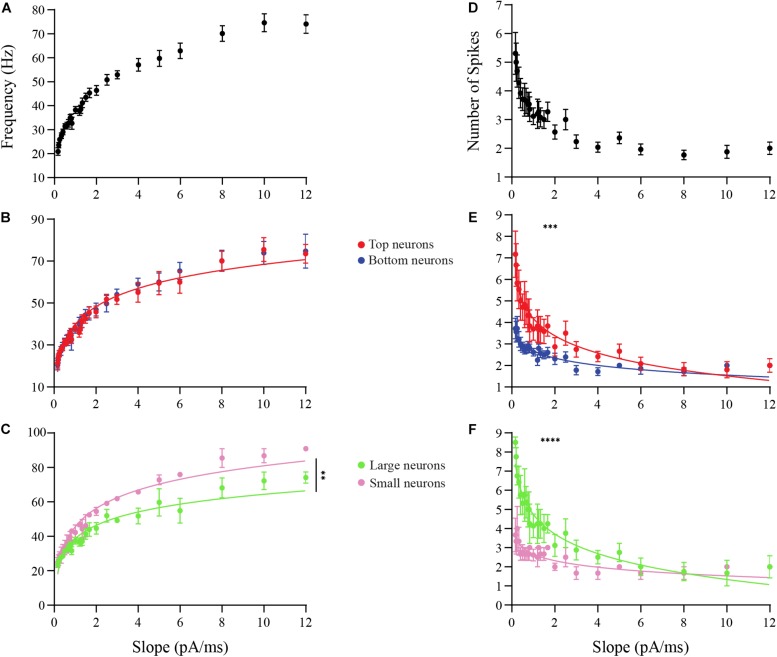
FIGURE 7.
Analysis of the effects of ramp slopes on the spike frequencies and the number of spikes of OB DA neurons. (A) The frequency responses (in Hz) of neurons (n = 13) that spiked more than once per ramp stimulus increase with increasing ramp slopes. (B) After transforming these power functions into log-log plots (see section “Materials and Methods”), there was no difference (n = 13, p = 0.3544) in the increasing spike frequencies with increasing ramp slopes between Top and Bottom DA neurons. (C) The increasing spike frequencies with increasing ramp slopes was significantly higher (n = 7, p < 0.0043**) in Small than Large neurons. (D) Number of spikes produced with increasing ramp slopes of neurons (n = 13) drops dramatically, particularly between 0 and 2 pA/ms ramps. (E) Top DA neurons produced a significantly greater decrease in spikes across increasing ramp slopes than did Bottom neurons (n = 13, p = 0.0009***). (F) There was an even greater decrease in spikes across increasing ramp slopes in Large compared to Small DA neurons (n = 7, p < 0.0001****).

