
Fig. 2.
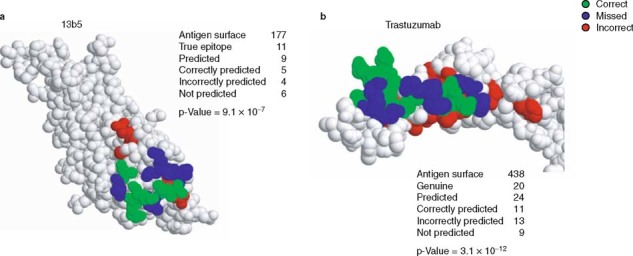
Space-filling representation of Mapitope predictions of (a) the monoclonal antibody 13b5 epitope on the surface of HIV-1 p24 antigen and (b) the trastuzumab epitope on the surface of the HER-2/neu receptor.[78] The number of amino acids comprising each antigen’s surface, genuine and predicted epitopes are given. Also given is the number of correctly predicted residues (indicated in green), over-predicted residues (indicated in red) and residues that were missed (indicated in blue). The p-values express a hyper-geometric distribution (the probability of randomly predicting the epitope) and were calculated as described by Mayrose et al.[85]