6.

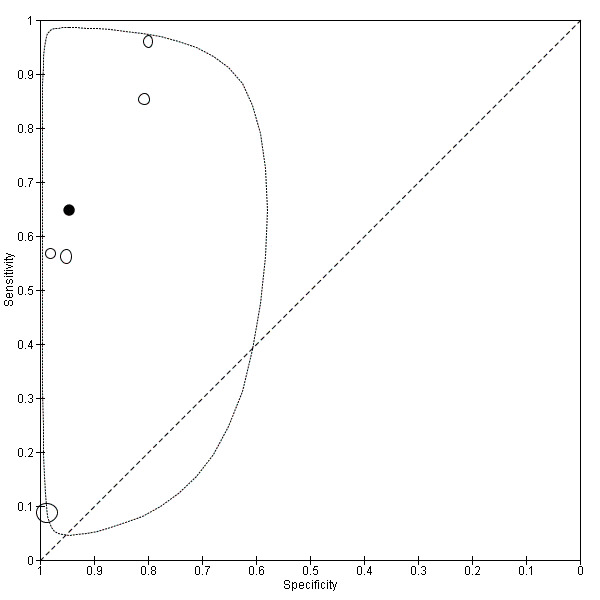
Summary ROC plot of TVUS for detection of pelvic endometriosis. Each point represents the pair of sensitivity and specificity from a study. The size of each point is proportional to the study sample size. The solid black circle represents the pooled sensitivity and specificity, which is surrounded by a 95% confidence region (dashed line).
