
14.
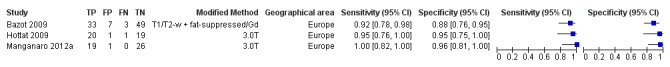
Forest plot of MRI for detection of ovarian endometriosis. Plot shows study‐specific estimates of sensitivity and specificity (squares) with 95% CI (black line). Studies are ordered by year of publication. FN: false negative; FP: false positive; TN: true negative; TP: true positive.