
35.
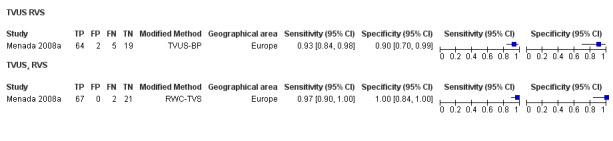
Forest plot demonstrating the direct comparison between TVUS and RWC‐TVS for RVS involvement. Plot shows study‐specific paired estimates of sensitivity and specificity (squares) with 95% CI (black line) and country in which the study was conducted. FN: false negative; FP: false positive; TN: true negative; TP: true positive. Modifications to the conventional technique are presented as 'modified method'.