51.

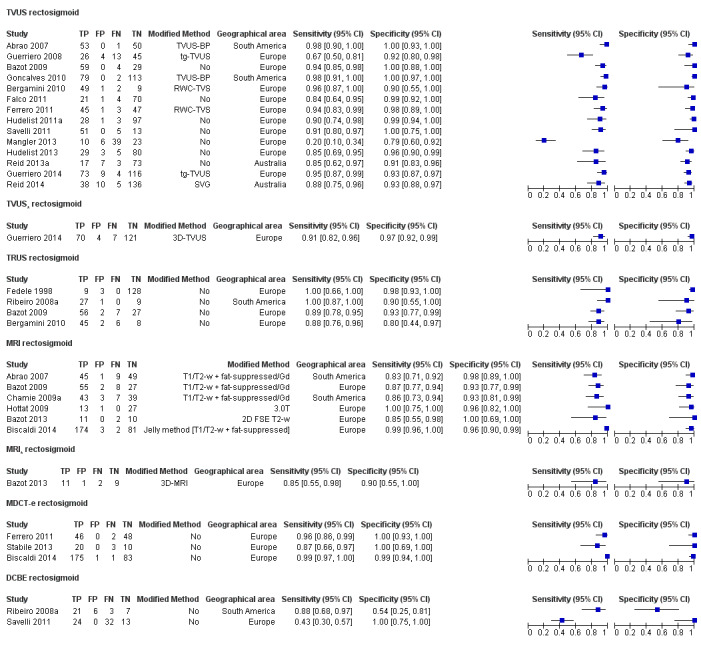
Forest plot of all imaging tests for diagnosis of rectosigmoid involvement. Plot shows study‐specific paired estimates of sensitivity and specificity (squares) with 95% CI (black line) and country in which the study was conducted. Studies are ordered according to year of publication for each test. Tests on the same population (different TVUS and MRI methods) are presented separately as TVUS* and MRI*. FN: false negative; FP: false positive; TN: true negative; TP: true positive. Modifications to the conventional technique are presented as 'modified method'.
