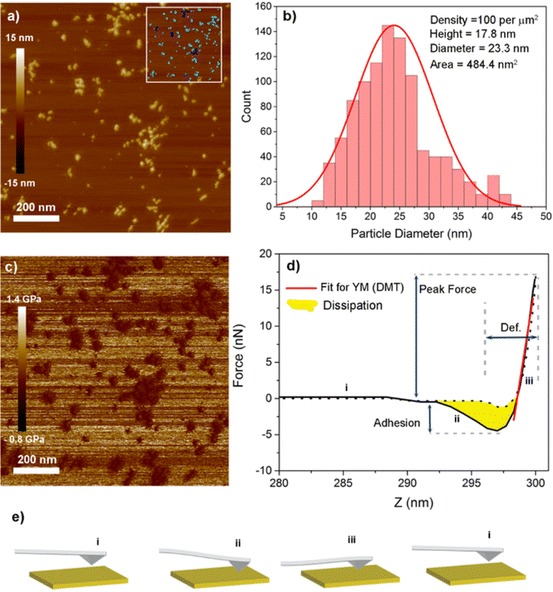
Fig. 21.

AFM as a tool for NP characterisation. a Topographical image of cationic star polymer siRNA complexes. Inset shows the results of a particle analysis tool (Bruker NanoScope Analysis software): individual particles (turquoise) contribute to statistics whilst aggregated particles are eliminated (dark blue). b A histogram showing distribution of particle diameters; text on the top right shows mean values of parameters calculated by the analysis tool. c QNM-AFM image recorded simultaneously using PeakForce Tapping mode (Bruker). d A representative force–distance curve generated for every pixel in the QNM-AFM image. The curve is fitted in the repulsive regime (iii) in order to calculate Young’s modulus (YM) (red line). e Graphical representation of the deflection of the AFM tip as it oscillated through one cycle
