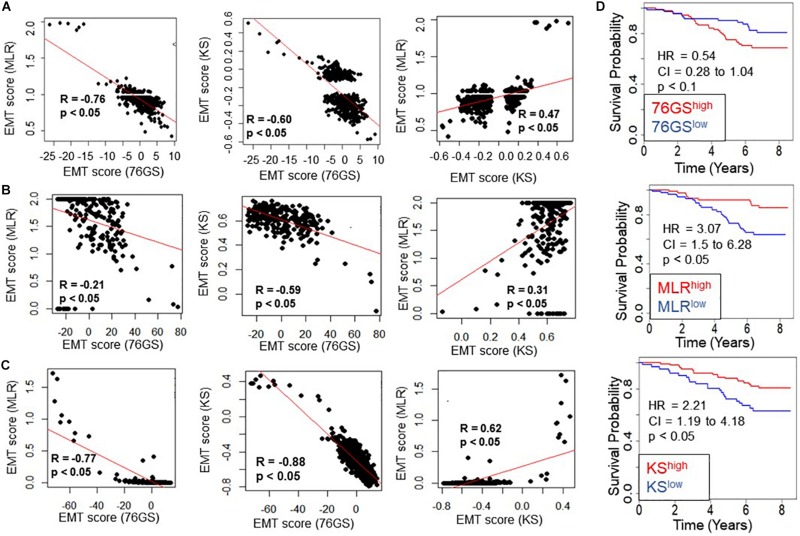
FIGURE 3.
Concordance across all three EMT scoring methods in quantification of EMT and survival prediction of tumor patients. Each pairwise relation is estimated by linear regression (red), Pearson’s correlation coefficient (R), and p-value (p), reported in each plot. (A) TCGA ovarian cancer dataset, (B) TCGA sarcoma dataset, (C) TCGA breast cancer dataset. (D) Correlation between EMT score (high vs. low) and overall survival (OS) in breast cancer patients. Kaplan–Meier survival analysis is performed to estimate differences in survival of 76GShigh, MLRhigh, KShigh and 76GSlow, MLRlow, KSlow groups, respectively, in GSE1456. p-values (p) reported are based on the log rank test. HR (hazard ratio) and confidence interval (95% CI) reported are estimated using cox regression.

