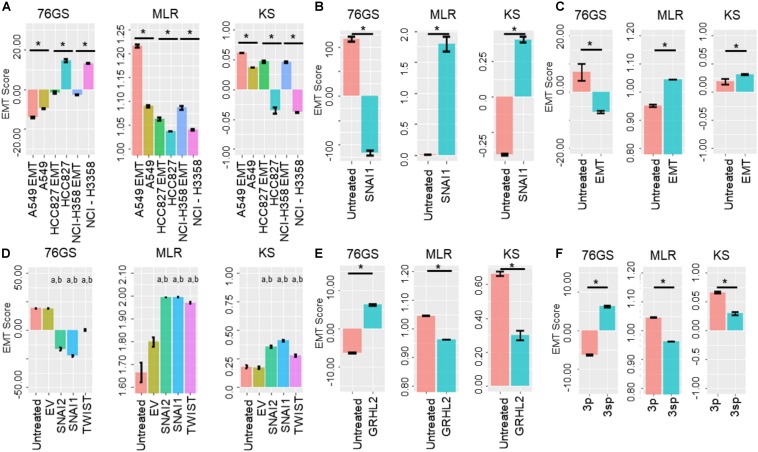
FIGURE 5.
Bar plots showing EMT scores of different cell lines calculated using the three EMT scoring methods. (A) EMT induction is shown in three cell lines – A549, HCC87, and NCIH358 (GSE49664). (B) EMT induction in MCF7 cell line (GSE58252). (C) EMT induction in EpRas cells (GSE59922). (D) EMT induction by different EMT-inducing transcription factors. “a” denotes statistical significant difference (p < 0.05, n = 3, two-tailed Student’s t-test) for pairwise comparison of a given set with untreated (first column), “b” denotes the same when compared with empty vector (EV; second column) (GSE43495). (E) MET induction by GRHL2 in MDA-MB-231 cell line (GSE36081). (F) Two cell lines of hepatocellular carcinoma with varying EMT status (GSE26391). Each control case has been compared to EMT/MET induced case (*p < 0.05, n = 3, two-tailed Student’s t-test; error bars represent standard deviation).

