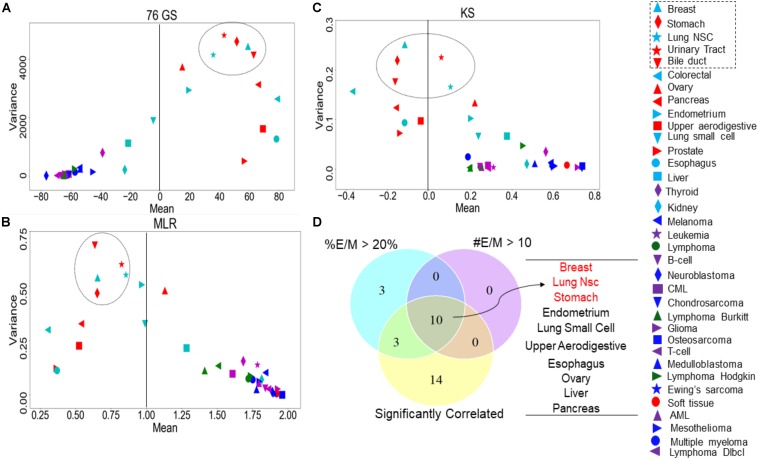
FIGURE 6.
Variance and mean of EMT scores in CCLE samples grouped by tumor subtype, highlighting the most variable tumor types (circled). (A) 76GS EMT scores, (B) MLR EMT scores, and (C) KS EMT scores. (D) Venn diagram showing the overlap between each tumor type based on the abundance of hybrid samples as defined by the MLR method, where #EM > 10 denote the cases where the absolute number of hybrid E/M samples in a tumor subtype is >10; %EM > 20 denote the cases where the percentage of cell lines identified as hybrid E/M in a given tumor subtype is >20%.

