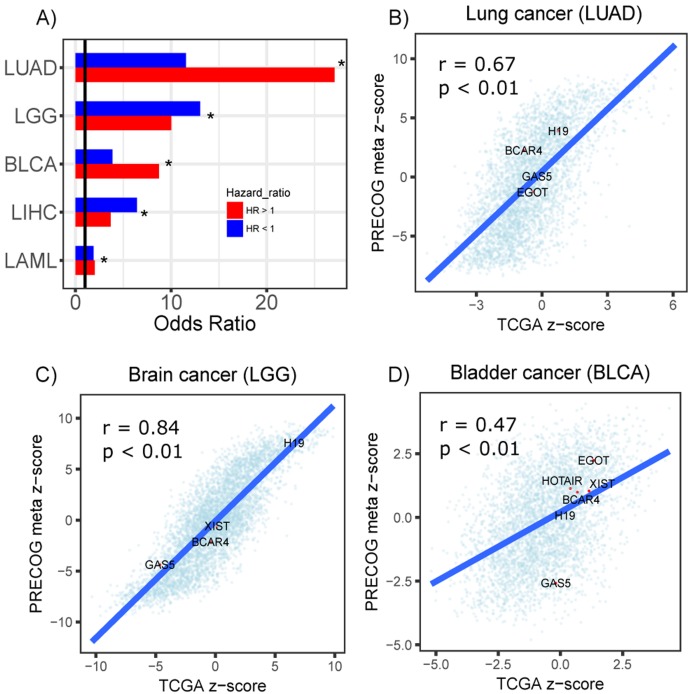
Figure 5. Prognostic lncRNAs identified in TCGA and PRECOG.
(A) Barplots showing odds ratios from enrichment analysis of prognostic lncRNAs identified in TCGA and PRECOG for LUAD, LGG, BLCA, LIHC and LAML. Enrichment analysis was performed separately for lncRNAs with hazard ratios >1 (Red) and <1 (Blue). Vertical black line denotes an odds ratio of 1. Scatterplots showing correlation of z-scores and meta z-scores for all lncRNAs screened in TCGA and PRECOG, respectively, in (B) lung cancer, (C) brain cancer and (D) bladder cancer. Labeled points denote lncRNAs that have been characterized in previous literature.

