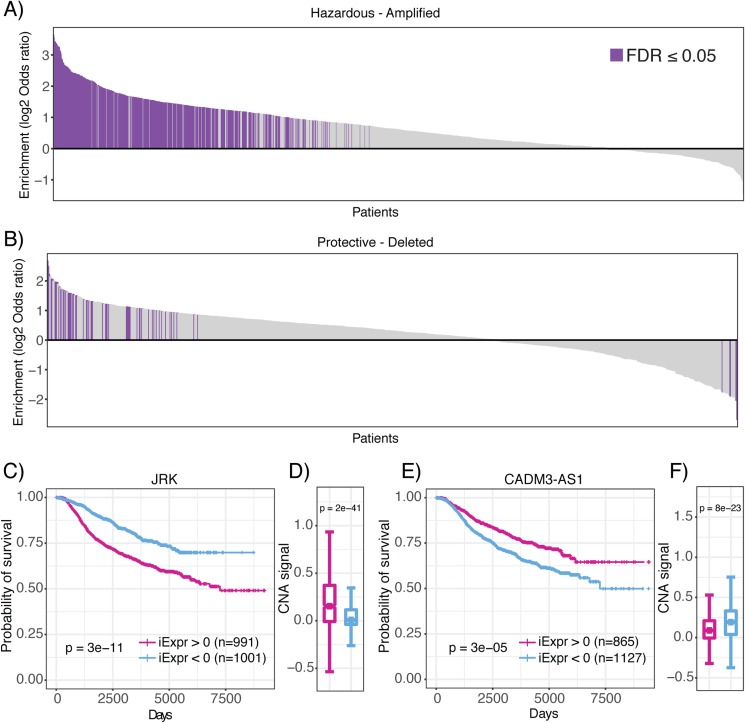
Figure 6. Enrichment of prognostic lncRNAs in genomic regions with copy number alterations.
Waterfall plots showing enrichment of (A) hazardous and (B) protective lncRNAs in amplified and deleted regions of the genome for each patient, respectively. Log2 odds ratio >0 indicates enrichment and log2 odds ratio <0 indicates depletion. Purple bars indicate statistically significant enrichment. (C) High JRK inferred expression is associated with poor prognosis. (D) High JRK inferred expression is concentrated in regions with higher copy number signal across all METABRIC patients. (E) High CADM3-AS1 inferred expression is associated with favorable prognosis. (F) High CADM3-AS1 inferred expression is concentrated in genomic regions with lower copy number signal across all METABRIC patients.

