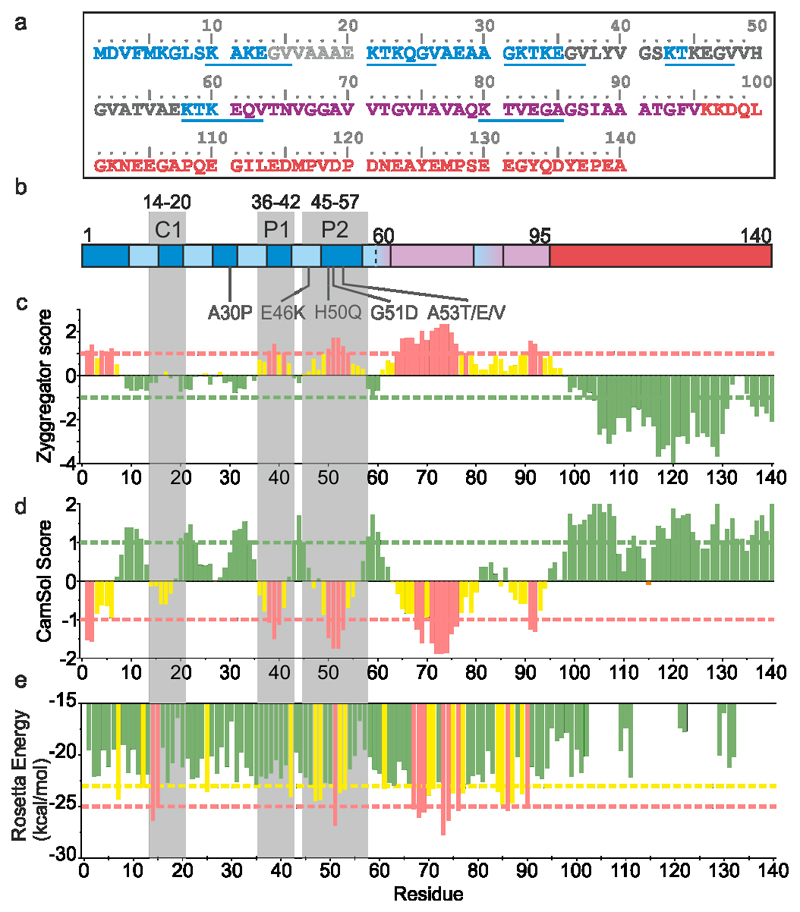
Figure 1. Aggregation and solubility profiles of αSyn.
a) The sequence of human αSyn. The N-terminal region (1-60), NAC region (61-95) and C-terminal region (96-140) are coloured in blue, pink, and red, respectively. The C1 and P1/P2 regions shown in (b) are coloured pale grey and dark grey respectively. The imperfect KTKEGV repeats are underlined in blue. b) Regions of αSyn highlighting the imperfect KTKEGV repeats in the N-terminal region (light blue), the positions of the seven familial PD mutants, and the P1, P2 and C1 control sequence highlighted as in (a). c), d) and e) Zyggregator37, Camsol38 and ZipperDB39 profiles for the αSyn sequence, respectively. Red bars indicate aggregation-prone/low solubility regions. Yellow bars indicate residues with a higher than average aggregation propensity/low solubility, but which do not meet the threshold. Red dashed lines indicate the low solubility/high aggregation propensity threshold, while green dashed lines show threshold values for high solubility/low aggregation propensity. For Zipper DB, the yellow dashed line shows the threshold value of residues with a high probability of β-zipper formation39. Data for graphs in c-e are available as Source Data.

