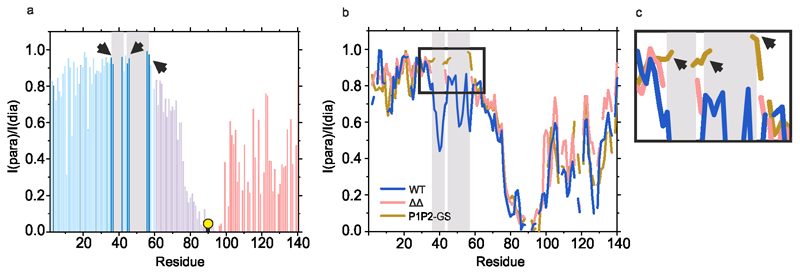
Extended data Figure 5. Intramolecular PRE experiment for P1P2-GS αSyn.
a) Intramolecular PRE intensity ratios of amide protons (paramagnetic/diamagnetic) for P1P2-GS αSyn with the MTSL spin label at A90C at low ionic strengths (20 mM NaCl), 15 °C, pH 4.5. Blue, pink and red bars show intensity ratios for residues in the N-terminal, NAC and C-terminal regions, respectively. Dark blue bars highlight residues in the P1/P2 regions that could be assigned and measured. The grey boxes mark the P1/P2 regions. Black arrows show only a small PRE effect is observed in the P1/P2 region for P1P2-GS. Due to the repeating Gly and Ser residues in the P1/P2 sequence not all residues could be assigned (Methods). b) Comparison of a rolling window (over 5 residues for easier comparison) of the PRE effects for WT (blue), ΔΔ (red) and P1P2-GS (orange) αSyn. The black box is zoomed out in c) to highlight residues in the P1/P2-region. The data for WT and ΔΔ are shown in Figures 4d and 5d.

