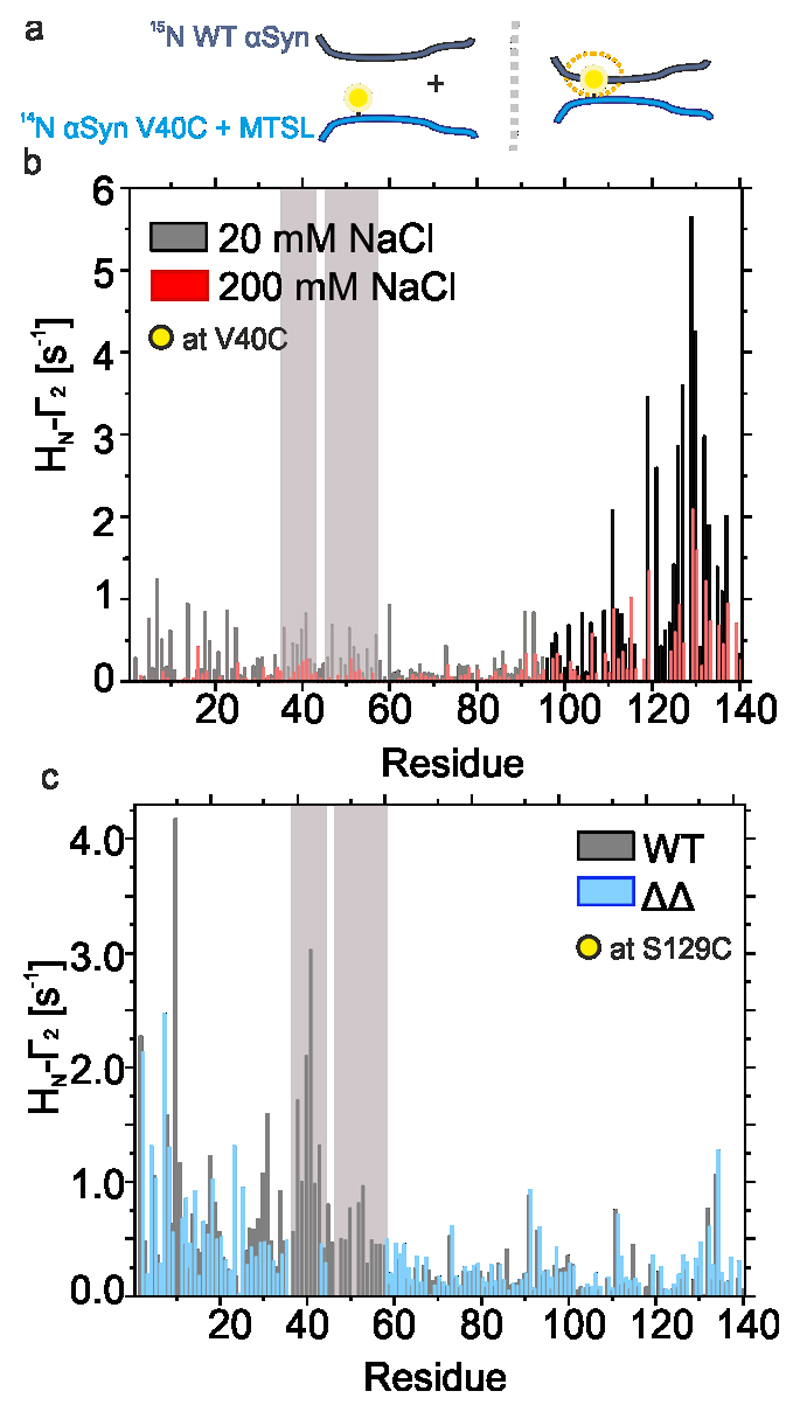
Extended data Figure 6. The role of P1 and P2 in intermolecular interactions.
a) Schematic of intermolecular PRE experiments. 14N and 15N αSyn are illustrated as cyan and dark blue chains, respectively. MTSL is shown as a yellow circle. b) HN-Γ2 rates for WT αSyn labelled with MTSL at position 40 (A40C) at pH 4.5 in low salt (20 mM added NaCl) (black) or high salt (200 mM added NaCl) (red) conditions, 15 °C. Bars depict residue specific HN-Γ2 rates. c) HN-Γ2 rates at pH 4.5 under low salt (20 mM added NaCl) for WT (black) or ΔΔ (blue) αSyn labelled at position 129 (S129C). Bars depict residue-specific HN-Γ2 rates.

