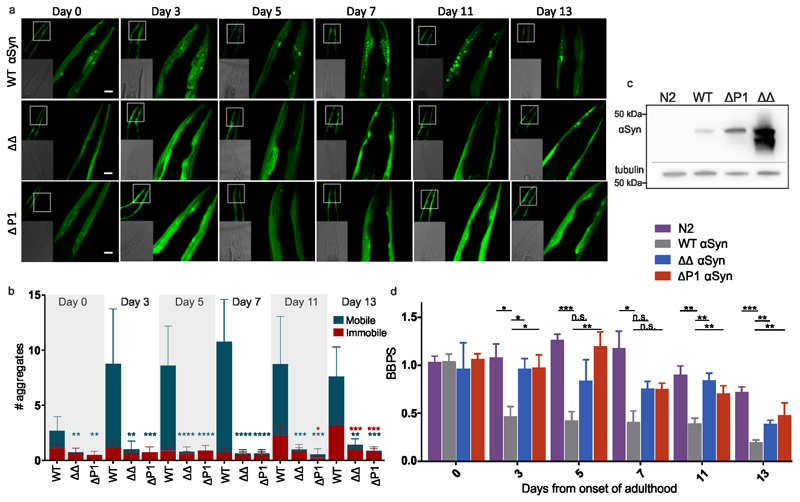
Figure 6. Deletion of P1 or P1/P2 in C. elegans expressing αSyn::YFP suppresses aggregation and proteotoxicity.
a) Confocal microscopy images showing the head region of transgenic C. elegans expressing WT αSyn, ΔΔ or ΔP1 tagged C-terminally to YFP in the bodywall muscle during ageing (Day 0 to Day 13 of adulthood). Scale bar, 10 μm. b) Number of mobile and immobile inclusions larger than ~2 μm2 per animal between the tip of the nose and pharyngeal bulb during ageing determined using FRAP. Data shown are the mean and s.e.m. for three independent experiments (biological replicates); in each experiment, 10 worms (n = 10) were assessed for each time point. (n=10 worms). Blue stars indicate significance between the number of mobile aggregates of animals expressing WT αSyn or the variants ΔP1 or ΔΔ. Red stars indicate significance between the number of immobile aggregates exhibited in animals expressing WT αSyn compared with mutant animals. *P<0.05; **P<0.01; ***P<0.001; ****P<0.0001. A one-sided Student’s t test was used in all cases. c) Western blot analysis of protein extracts isolated from N2, WT αSyn::YFP, ΔP1::YFP and ΔΔ::YFP animals using an anti-αSyn antibody (Methods). Tubulin was used as a loading control. The loading control (anti-tubulin) was run on a different gel/membranes loaded with the same protein sample and treated and analysed in the same manner. The images were cropped showing all relevant bands. (d) Number of body bends per second (BBPS) of N2, WT αSyn::YFP, ΔP1::YFP and ΔΔ::YFP animals from Day 0 (L4 stage) through to Day 13 of adulthood. Data shown are mean and s.e.m. for three independent experiment; in each experiment, 10 worms were assessed for each time point. n=10 for each experiment and error bars represent SEM of three biological replicates. n.s. = not significant; **P<0.01; *P<0.05, a one-sided test was used. Data for graphs in b-d are available as Source Data.

