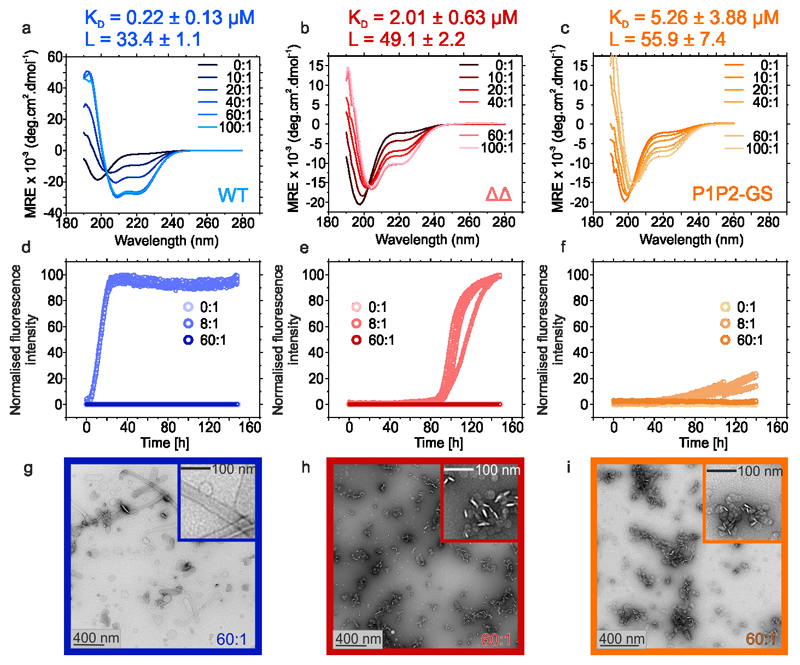
Figure 7. Lipid-induced aggregation kinetics of WT αSyn and its variants.
a-c Far-UV CD spectra of 25 μM WT αSyn (a), ΔΔ (b) or P1P2-GS (c) incubated with increasing ratios of [DMPS]:[protein]. KD and L values were calculated from the change in MRE at λ222nm fitted to a single step binding model61 (Extended Data Figure 7b). Aggregation kinetics of 50 μM αSyn WT (d), ΔΔ (e) or P1P2-GS (f) incubated with 0:1, 8:1 or 60:1 [DMPS]:[protein] (20 mM sodium phosphate, pH 6.5; 30 °C, no shaking). g-j TEM images of representative samples of WT αSyn (g), ΔΔ (h) or P1P2-GS (i) at the endpoint of the incubations (150 h) in the presence of 60:1 [DMPS]:[protein]. Data for graphs in a-f are available as Source Data.

