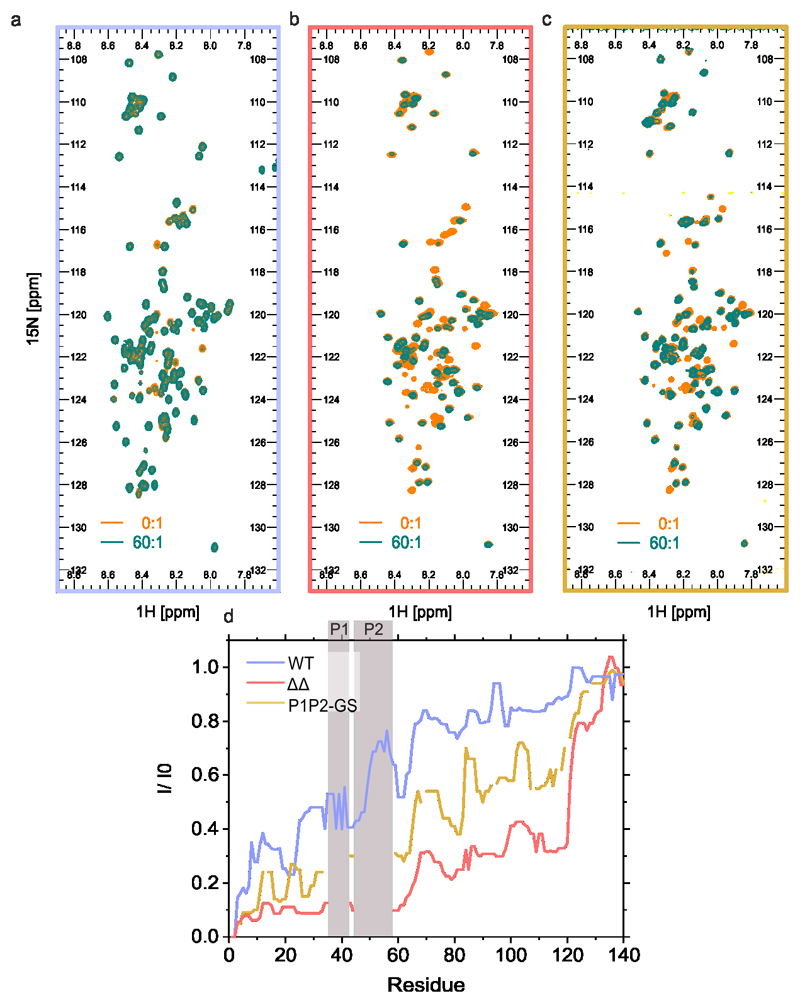
Figure 8. NMR experiments detailing the molecular basis of liposome binding of WT αSyn ΔΔ and P1P2-GS.
1H-15N HSQC NMR spectra of a) WT αSyn, b) ΔΔ and c) P1P2-GS in the presence (green) or absence (orange) of a 60:1 ratio of [DMPS]:[protein]. d) Intensity ratios (presence/absence of liposomes) of cross-peaks for WT αSyn (blue), ΔΔ (red) and P1P2-GS (orange) are shown by illustrating the median value over a rolling window of five residues determined using OriginPro. The position of P1 and P2 is highlighted with grey bars. Note that residues 36-42 and 45-57 are deleted in ΔΔ and these residues (replaced with (SG)3S (P1) and (GS)6G (P2)) could not be assigned for P1P2-GS. Data for graph in d are available as Source Data.

