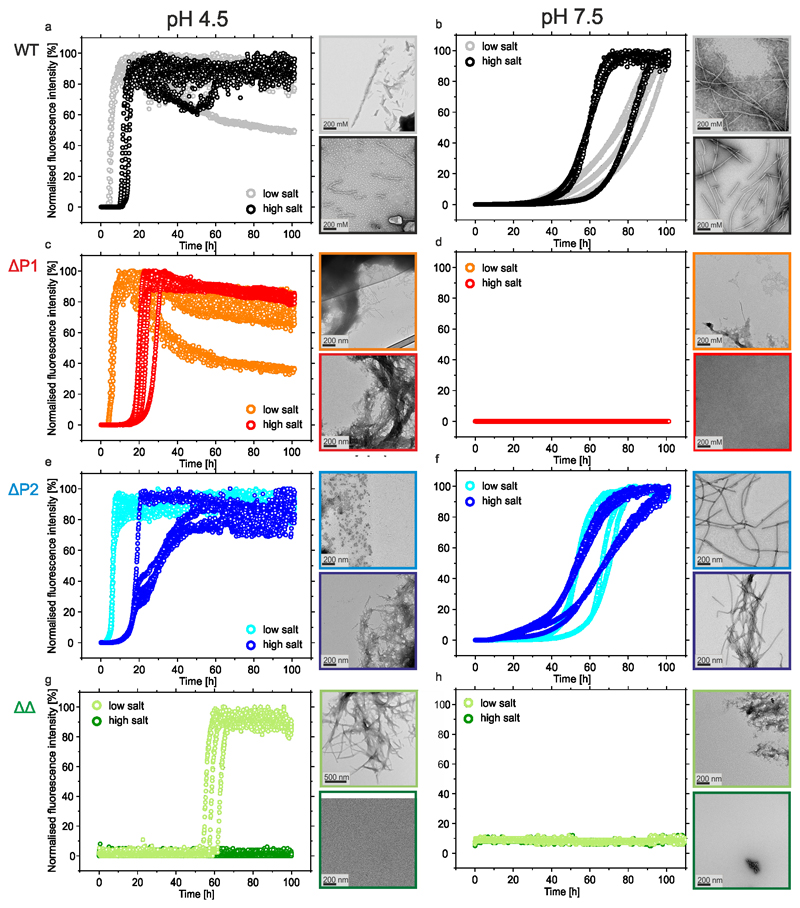
Extended data Figure 1. Aggregation kinetics of αSyn variants at different pH and salt conditions including TEM images of the aggregates (if any) formed at the end point.
ThT fluorescence assays at pH 4.5 or pH 7.5 of a,b) WT αSyn, c,d) ΔP1, e,f) ΔP2 and g,h) ΔΔ at high (200 mM NaCl) or low (20 mM NaCl) ionic strength (n≥3). Negative stain TEM images of representative samples of the aggregates formed at the end point (100 h) are shown alongside each plot using the same colour scheme. The fibril yield under each condition, determined by SDS PAGE subsequent to centrifugation (see Methods) is shown in Supplementary Table S1.

