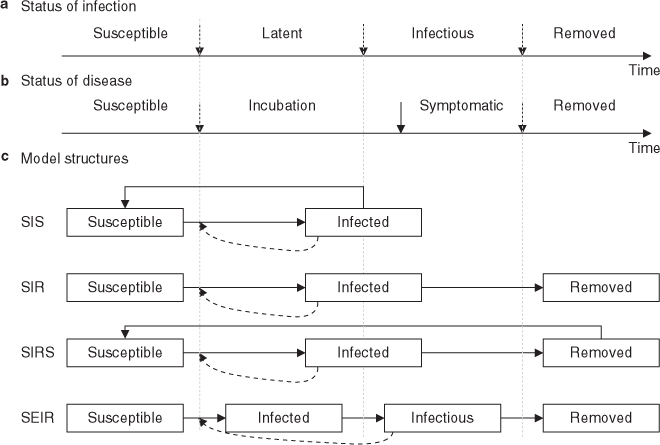
Fig. 4.

Timeline for the natural history of (a) infection and (b) disease, together with (c) corresponding model structures. In (c), direct lines indicate movement between health states, while dotted lines indicate that the rate at which susceptible individuals are infected is influenced by the proportion of the population that is infectious. SEIR = susceptible-exposed-infectious-recovered; SIR = susceptible-infectious-recovered; SIRS = susceptible-infectious-recovered-susceptible; SIS = susceptible-infectious-susceptible.
