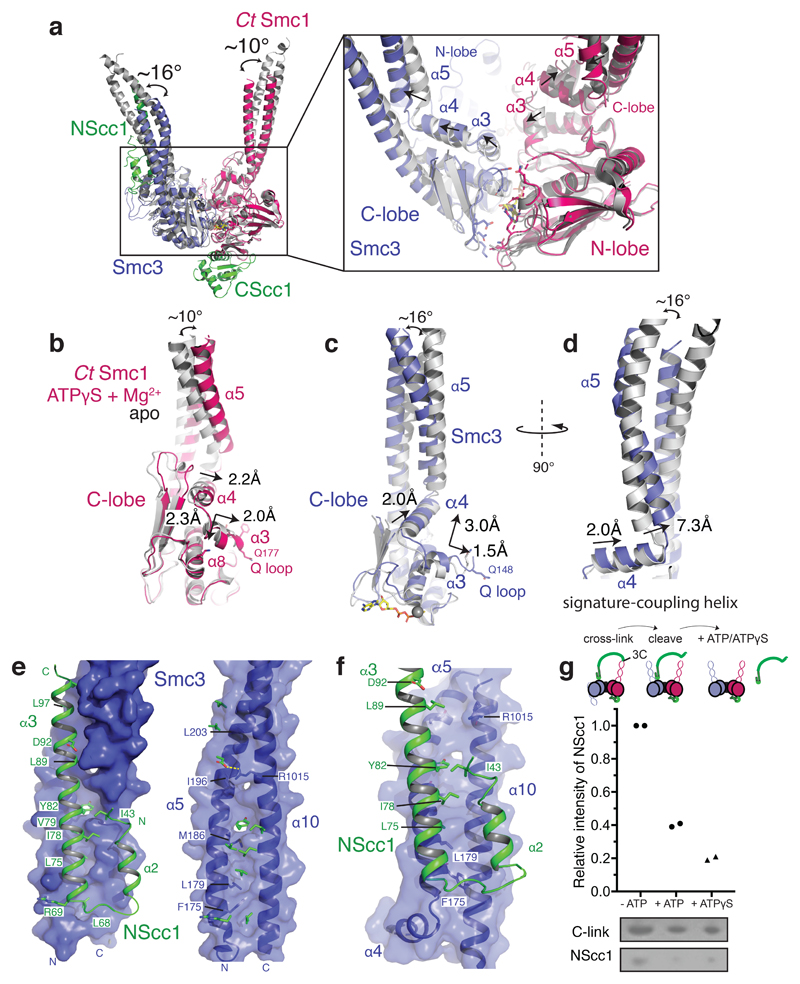
Figure 2. Conformational changes in the engaged cohesin head module lead to remodeling of the NScc1–Smc3 interface.
a, Conformational changes in the coiled coil of the ATPγS and Mg2+ engaged cohesin head module as compared to homodimeric Smc3 (PDB 4UX3) and apo CtSmc1 (both in grey) are indicated with curved arrows. The binding site of NScc1 (green) is indicated. Inset: zoomed view of the ATPase active site. The directions of movements are indicated with arrows in α3, the signature-coupling helix α4 and the N-terminal end of the coiled coil α5 in the C-lobe of CtSmc1 (red) and Smc3 (blue). b, Details of the displacement of α3, the signature-coupling helix α4 and the coiled coil α5 in CtSmc1 (bound and apo forms are depicted in red and grey respectively). c, and d, Details of the displacement of Smc3 coiled-coil and signature-coupling helices upon cohesin head engagement and DNA exit gate release (hetero- and homodimeric forms of Smc3 are depicted in blue and grey respectively). For clarity, NScc1 is omitted from the homodimeric form. e, Surface representation of the Smc3 coiled coil (blue) from the ‘closed’ Smc3–NScc1 gate structure. PDB:4UX3. Amino acid residues from NScc1 (green; left) engage Smc3 through a set of surface pockets lined by conserved hydrophobic amino acid residues of Smc3 (right). f, Surface representation of the rearranged Smc3 coiled coil (blue). The NScc1 binding site is occluded by remodeling of the cognate Smc3 interface. g, C-link complexes, harboring a 3C protease in NScc1, were cross-linked and incubated with 3C prior to immobilization on Ni2+-conjugated beads. Quantification of NScc1 retention by c-link complexes in the presence or absence of nucleotide is depicted in a scatter plot. Representative silver-stained SDS-PAGE bands are boxed, and the corresponding proteins indicated. Data from two independent experiments are plotted. Data for the graph and uncropped gel images are available as source data.

