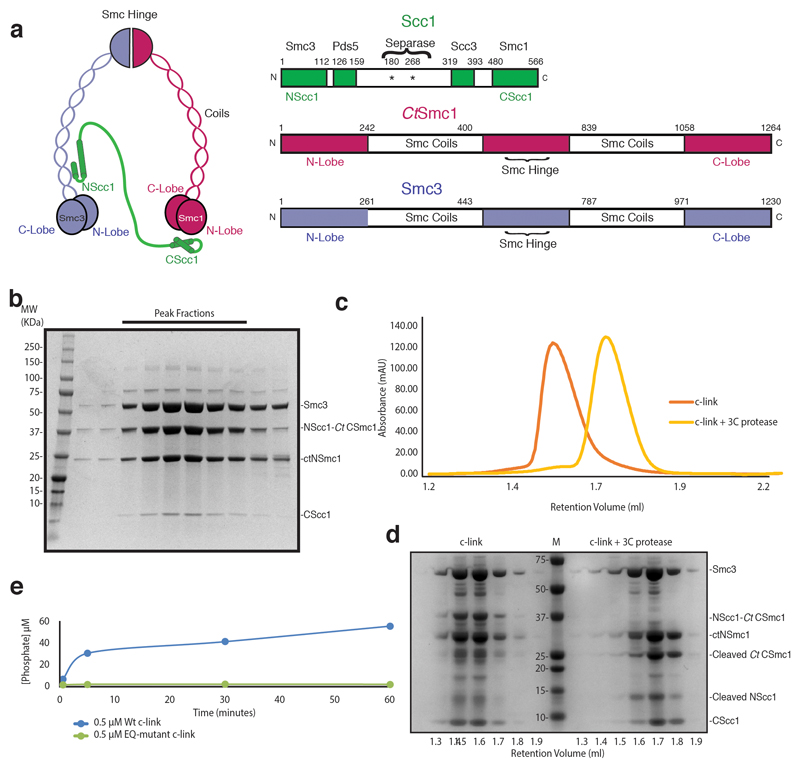
Extended Data Fig. 1. Cohesin domain organization and purification of c-link complexes.
a, Domain organization and cartoon depiction of the cohesin complex. b, SDS-PAGE analysis of a representative c-link purification. Bands corresponding to each subunit are indicated. c, Size-exclusion chromatography analysis of c-link prior to (orange) and following 3C-mediated cleavage (yellow) of the NScc1–CtCSmc1 linker. Elution volume of molecular weight standards are shown. d, SDS-PAGE analysis of indicated fractions corresponding c, (c-link left of marker; 3C-treated c-link to the right). e, ATPase assays of wild-type (Wt) and Walker B (EQ) mutant c-link. A single experiment was performed at the indicated protein concentration. Data for the graphs in c and e are available as source data.

