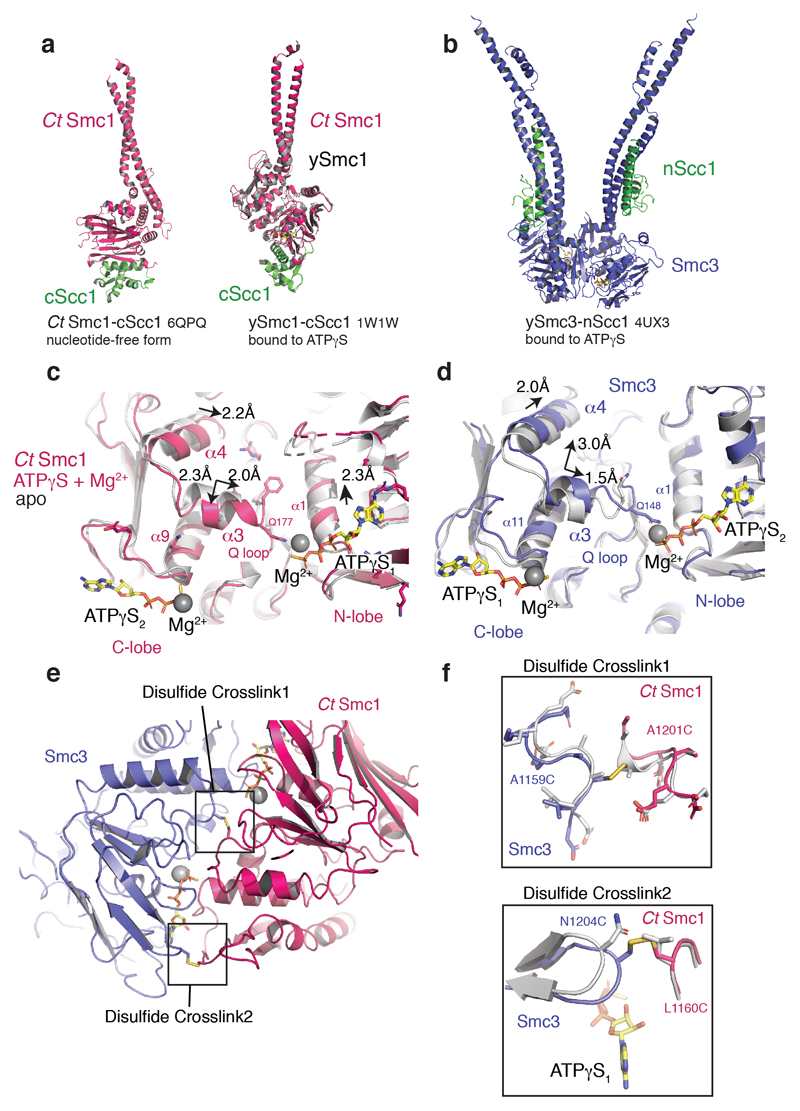
Extended Data Fig. 3. Comparative structural analysis of the cohesin ATPase.
a, Structural alignment-based superposition of the RecA N-lobes of apo CtSmc1–CScc1 (red) and ATPγS-bound ySmc1–CScc1 complex (grey; PDB code 1W1W). Cα root-mean-square deviation [RMSD] = 0.98 Å. b, The Smc3–NScc1 ATPγS complex (PDB code 4UX3). c, Relative motions of α-helices within the ctSmc1 ATPase upon ATPγS binding and head heterodimerization. d, Relative motions of α-helices within the ySmc3 ATPase upon ATPγS binding and head heterodimerization. e, The cross-links are positioned in loops between secondary structural elements. f, Structural details around the cross-linked disulfides. Smc3 N1204 and CtSmc1 L1160 are closely apposed in the modeled heterodimer (grey). Replacement of these residues by cysteine allows cross-linking without major distortions in the Smc heterodimer. The cystine disulfide bonds are indicated in yellow.

