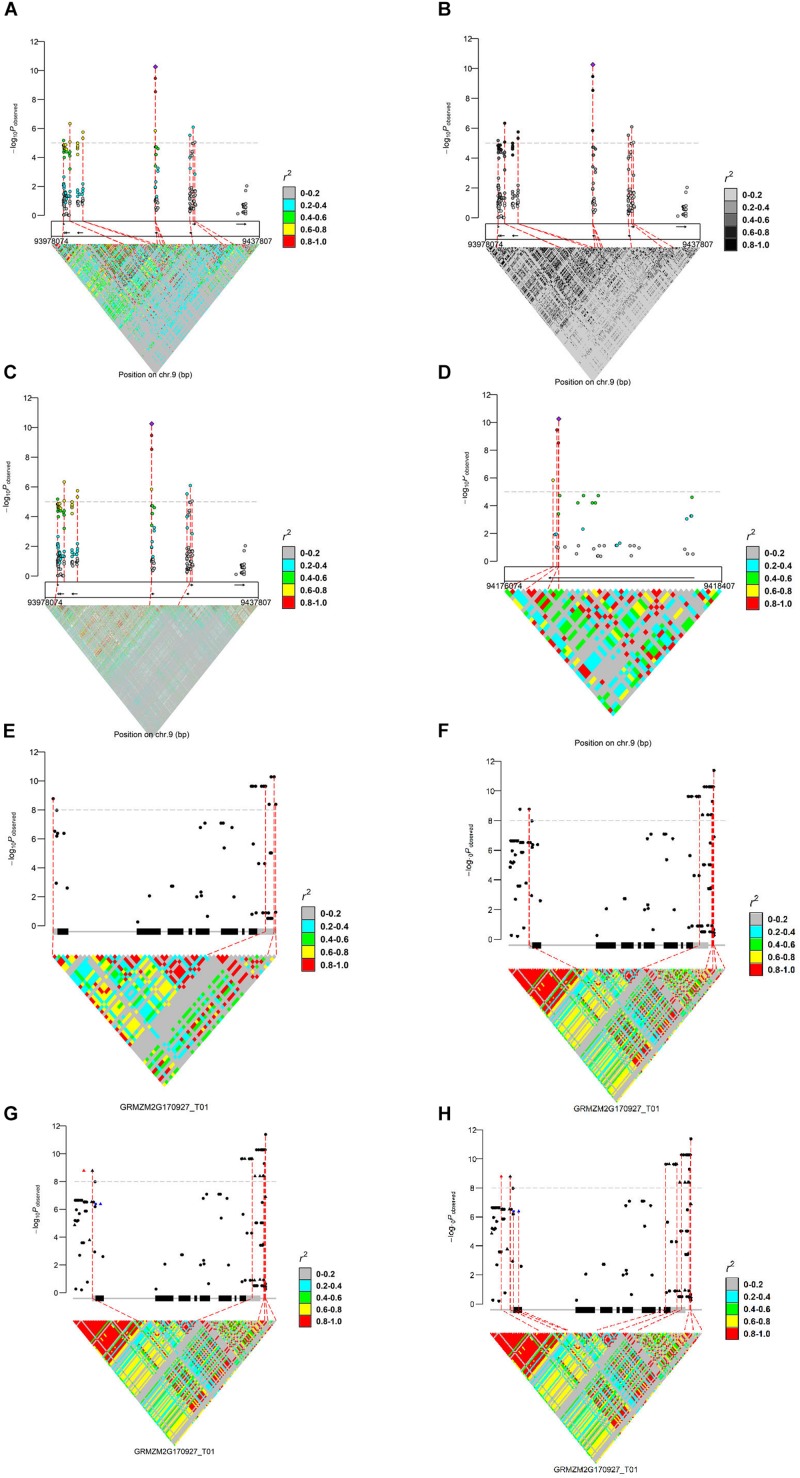
FIGURE 1.
Regional marker-trait associations plot (A: regional plot; B: LD color scale; C: LD matrix from another genotypes; and D: zoom-out) and a single gene-based marker-trait associations plot (E: single genic plot; F: adjusting flanking sequence; G: highlighting markers; and H: linking markers), using previously published data (Wang et al., 2016). For (A–D), the upper layer represents the marker-trait associations and LD of the most significant loci with the others; the middle layer shows the filtered gene models indicated by arrows (MaizeGDB release 5b.60); the bottom layer shows LD matrix. In (E–H), the main transcript structure of ZmVPP1 and the LD matrix are shown. Genotypes used to generate these plots were derived from Chia et al. (2012), Li et al. (2013), and Wang et al. (2016).

