
Figure 3.
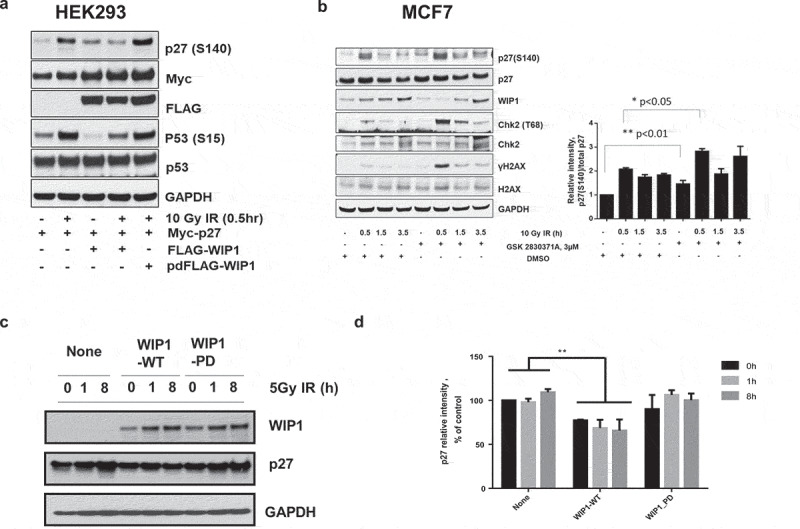
WIP1 dephosphorylates p27Kip1 in vivo. (a) WIP1 dephosphorylates p27Kip1 S140 in HEK293 cells. HEK293 cells were transfected with Myc-p27 or p53 and Flag-WIP1 or Flag-WIP1-PD (phosphatase-dead) and irradiated with 10 Gy IR with 0.5 hours recovery. Immunoblot analysis was performed with indicated antibodies. (b) WIP1 inhibition in MCF-7 cells leads to a delay in p27Kip1 S140 phosphorylation levels returning to homeostatic levels after DNA damage treatment. MCF7 cells were pretreated with 3 uM of a WIP1-specific inhibitor (GSK 2830371A) and cells were irradiated with 10 Gy IR. Cells were recovered up to 3.5 h post IR treatment. For each indicated time point, cells were lysed and subjected to immunoblot analysis with the indicated antibodies. In addition to using antibodies to p27Kip1 and p27 S140, we immunoblotted with antibodies to two other known WIP1 target proteins and their targeted sites (CHK2 T68 and H2AX S139). To clarify relative p27 protein and S140 phosphorylation levels, the intensity of p27 S140 and p27 protein bands for each condition were quantified with Image J and the ratio between p27 S140 and total p27 was calculated and noted in the bar graph to the right. P values were determined by t test. (c) WIP1 inhibition leads to decreased p27 stability before and after DNA damage treatment. HEK293 cells were co-transfected p27 with WIP1-WT or WIP1-PD and incubated for 24 h at 37◦C. Cells were irradiated with 5 Gy IR and recovered up to 8 h. Cells were lysed at indicated time points and subjected to immunoblot analysis with the indicated antibodies. (d) Quantitation of WIP1 effects on p27Kip1 stability. The intensities of p27 protein bands for each condition from Panel C were quantified with Image J and graphed. Bars compare relative p27Kip1 protein levels in non-transfected and WIP1-transfected cells. **p < 0.01 (n = 6). P values were determined by t test.