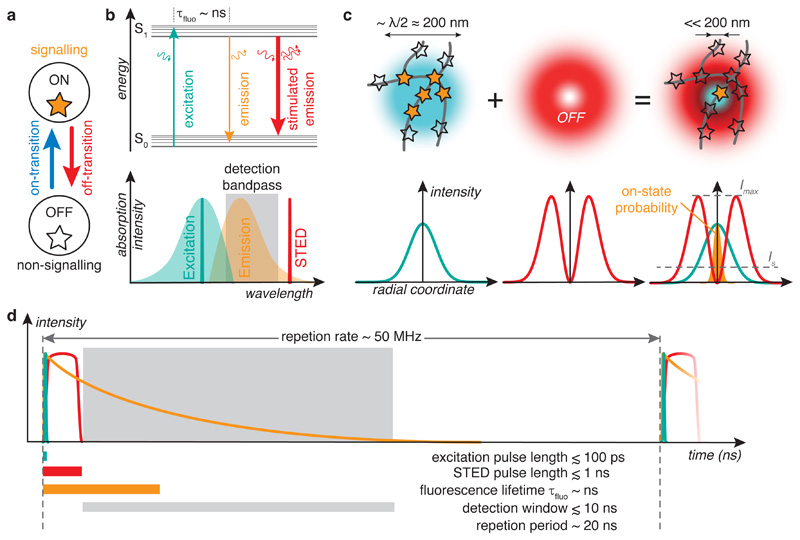
Figure 1.
STED nanoscopy. a Schematic of molecular states for nanoscopy. b Top: Energy diagram. S0, singlet ground state; S1, first excited state; τfluo, fluorescence lifetime. Curved arrows: photons. Bottom: Excitation and emission spectra of typical fluorophore with wavelengths for excitation and STED (vertical lines) and detection window. c Left: In conventional laser-scanning microscopy, all fluorophores within a diffraction-limited laser focus are excited simultaneously (orange stars) and are hence indistinguishable. Middle and right: In STED nanoscopy, a light pattern superimposed with the excitation focus transiently silences fluorophores (black stars) except for those located at an intensity zero, thus making fluorophores distinguishable on sub-diffraction length scales. IS, saturation intensity; Imax, maximum STED intensity. d Timing in STED nanoscopy. The scale is zoomed into an individual excitation (cyan) and STED (red) pulse pair. Fluorescence signal time course (orange) is indicated for the location of the STED light intensity zero. Signal integration time is typically (tens of) μs at each scan position. Colour code applies to all figures.

