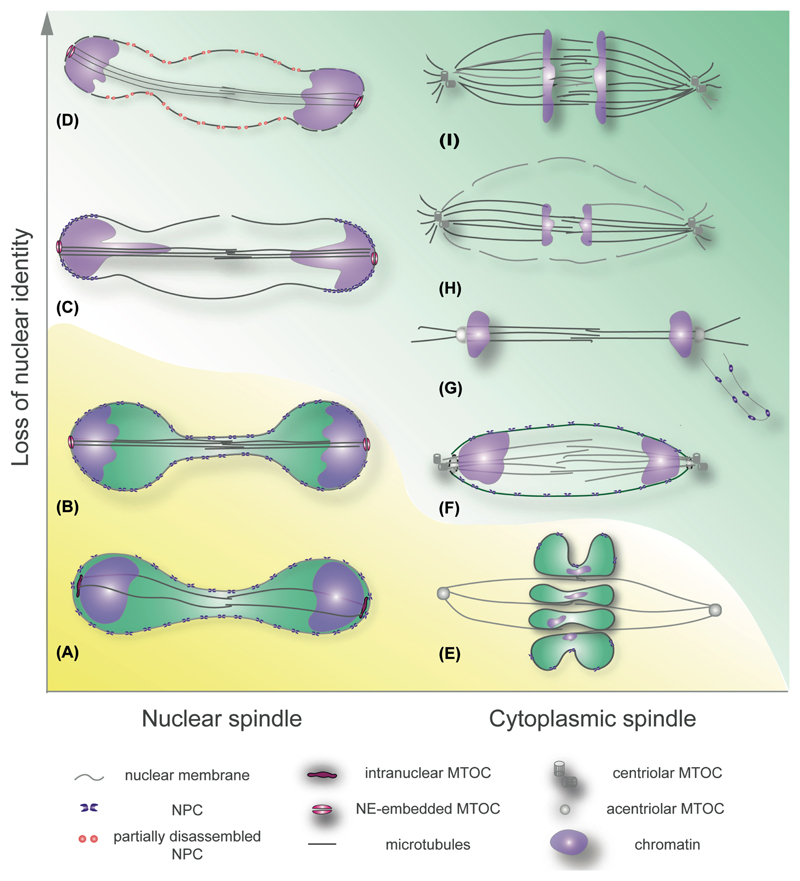
Figure 1.
Diagrams summarizing representative modes of mitosis across eukaryotes. The mitotic apparatuses are shown in anaphase. Left column: (A) the excavate Trypanosoma brucei, (B) the fission yeast Schizosaccharomyces pombe, (C) the fission yeast Schizosaccharomyces japonicus, (D) the filamentous Ascomycete Aspergillus nidulans. Right column: (E) the dinoflagellate Crypthecodinium cohnii, (F) the green algae Chlamydomonas reinhardtii, (G) an yeast form of the Basidiomycete Ustilago maydis, (H) an embryo of the nematode Caenorhabditis elegans, (I) a cultured human cell. Yellow background indicates “closed” modes of mitosis and green background denotes mitotic NE breakdown. Pictorial legend is shown below.

