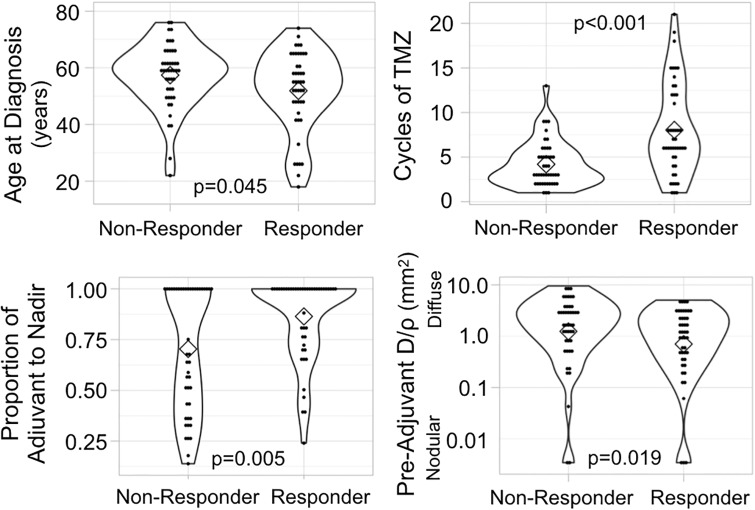
Fig 1. Characteristic differences between responders (n = 45) and non-responders (n = 45).
Statistical tests (t-tests) show that volumetric responders (decrease in T1Gd volume during adjuvant TMZ) were younger, received more cycles of TMZ, reached nadir relatively later during adjuvant therapy, and had more nodular tumors than non-responders (increase in T1Gd volume during adjuvant TMZ). Proportion of adjuvant to nadir is calculated as the number of days between pre-adjuvant and nadir images divided by the total number of days between pre-adjuvant and post-adjuvant images. (Black dots in the violin plots indicate individual subject values, diamonds indicate median values, and outline denotes frequency).

